
Further Hypothesis Tests
Loading the math board and drawing, please wait…
In collections
Pearson Maths A level Further Statistics 2
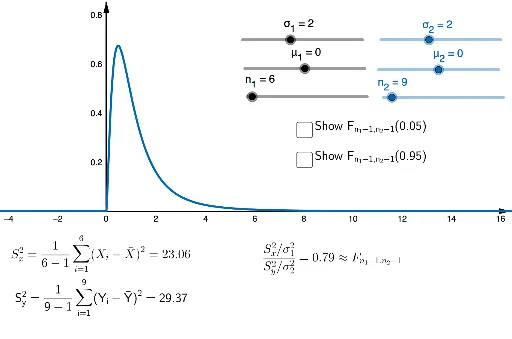
This example demonstrates hypothesis testing under the normal distribution, including mean and variance estimation and testing. It involves core mathematical concepts such as normal distribution, difference and slope analysis, statistics, ellipse, and cone. Construction highlights include commands like Sequence, RandomNormal, Sum, SampleVariance, Vector, FDistribution, NSolutions, Element, and Integral. Suitable for high school and above learners to understand statistical inference methods and geometric representations.
GeoGebra Commands & Parameters
Sequence(Segment[(-100, i), (100, i)], i, -50, 50, 1) → list2Sequence(Segment[(i, -100), (i, 100)], i, -50, 50, 1) → list4RandomNormal(μ_1, σ_1) → r1Sequence((RandomNormal[μ_1, σ_1^(2)], 0), i, 1, n_1) → l1Sum(l2) → s1SampleVariance(l2) → wVector((0, 0), (0, 1)) → vSequence((RandomNormal[μ_2, σ_2^(2)], 0), i, 1, n_2) → l5SampleVariance(l6) → w1FDistribution(n_1, n_2, 5) → f05FDistribution(n_1 - 1, n_2 - 1, x, true) → fcumNSolutions(fcum(x) = 0.95) → l3NSolutions(fcum(x) = 0.05) → ns05FDistribution(n_1 - 1, n_2 - 1, x, false) → fpdfElement(l3, 1) → cr95Element(ns05, 1) → cr05Integral(fpdf, cr95, 30) → int1Integral(fpdf, cr05, 30) → int2
AI Drawing Prompt Reference
Draw a statistical inference diagram: a fine grid coordinate plane with integer grid lines from -50 to 50. On the horizontal axis, place random points representing two sample groups, one centered around mean μ₁ and another around μ₂, with sample sizes n₁ and n₂ respectively. Draw a unit vector from the origin upward as a reference. On the right side, plot the probability density curve of an F-distribution, and mark two critical values (corresponding to 0.95 and 0.05 quantiles), shading the areas under the curve from each critical value to 30 to indicate rejection regions. The overall layout juxtaposes the sample distributions with the F-distribution, illustrating the geometric relationship between mean and variance hypothesis tests.
The prompt above was compiled from the original drawing commands and is for reference only.