
GeoGebra Example: Test Quality and Mathematical Function Demonstration
Loading the math board and drawing, please wait…
In collections
Pearson Maths A level Further Statistics 1
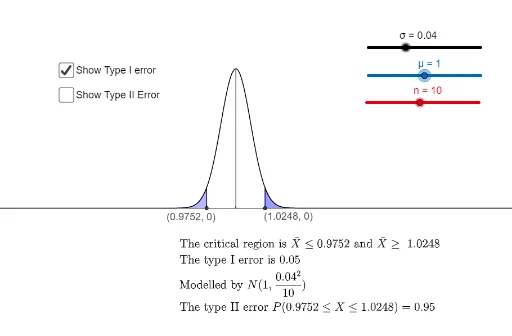
This example dynamically illustrates the relationship between test quality and mathematical functions using GeoGebra. It involves core concepts like straight lines, random variables, binomial distribution, exponential functions, and box plots. Key GeoGebra commands and objects used include Sequence, Integral, Intersect, Point, Vector, Segment, and parameters such as n, σ, μ, list2, list4, f, etc. Suitable for high school and above, it serves as a visual teaching tool for probability & statistics and calculus.
GeoGebra Commands & Parameters
Sequence(Segment[(-100, i), (100, i)], i, -50, 50, 1) → list2Sequence(Segment[(i, -100), (i, 100)], i, -50, 50, 1) → list4Integral(f, ((-k) * σ) + μ, (k * σ) + μ) → oIntersect(f, f_1, (1, 31.539156525252007)) → JPoint(f_1) → KIntersect(g, f_1) → MVector(M, K) → vSegment(M, J) → g_1Segment(Y_{2}, X_{2}) → jSegment(Y_{1}, X_{1}) → lIntegral(f, -30, c2) → int1Integral(f, c1, 30) → int2Integral(f, c4, c3) → int3Segment(Y_{3}, X_{3}) → m