
Three Continuous Distributions
Loading the math board and drawing, please wait…
In collections
Pearson Maths A level Further Statistics 2
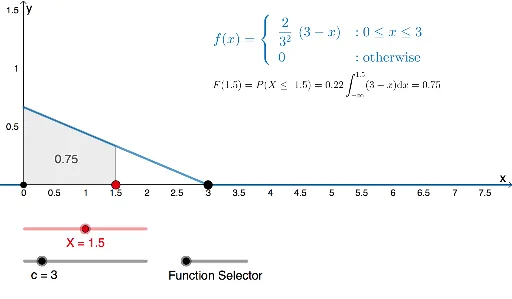
This example demonstrates the probability density functions of three continuous distributions and their calculations. Key math concepts include probability density functions, integration, mean, and variance. GeoGebra commands like SXY, SXX, Integral are used to compute statistics, with objects including a_1 to A_9, L_1 to L_3, sumxy, sumx, sumy, cor. Suitable for high school students and probability & statistics learners.
GeoGebra Commands & Parameters
SXY(L_{2}, L_{3}) → sumxySXX(L_{2}) → sumxSXX(L_{3}) → sumyIntegral(f1, a, X) → a1Integral(f2, a, X) → a2
AI Drawing Prompt Reference
Draw the probability density functions of three continuous distributions, showing their calculations. Plot three distinct curves representing different distributions, then mark their means and variances. Use integral symbols to indicate the integration of the probability density functions, and connect key calculation results like sums and correlation coefficients with points or lines to clearly show the relationships and steps of the statistics.
The prompt above was compiled from the original drawing commands and is for reference only.