
Hypothesis Testing Basics
Loading the math board and drawing, please wait…
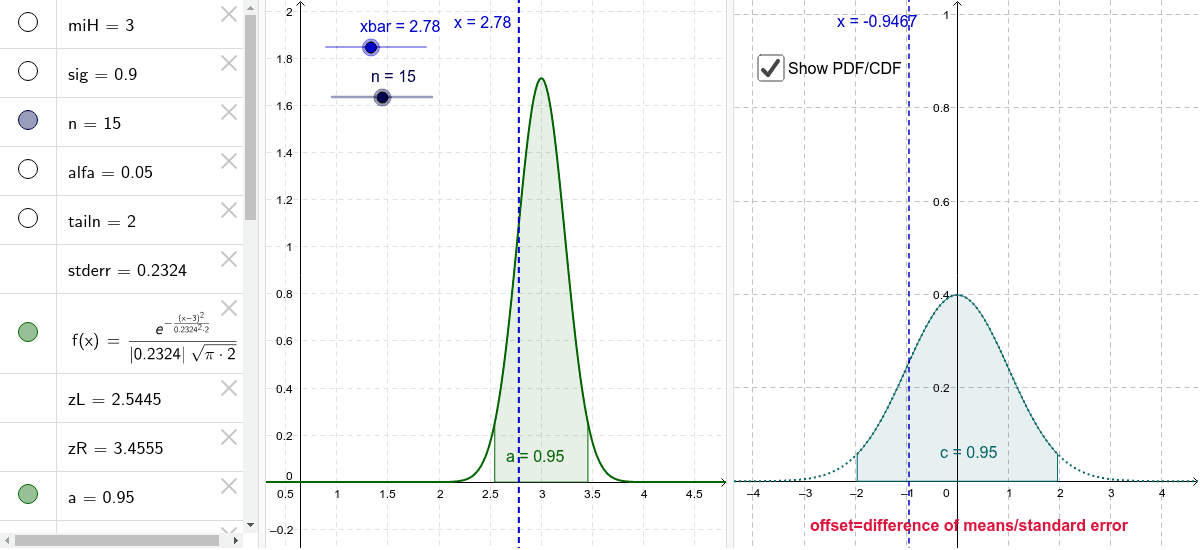
This example demonstrates the fundamental process of hypothesis testing, emphasizing both standardized and contextual data analysis. Core mathematical concepts include statistical inference, standard normal distribution, confidence intervals, and Z-tests. The construction utilizes GeoGebra commands like Normal, InverseNormal, Integral, and ZMeanTest, along with objects such as miH, sig, n, alfa, tailn, stderr, f, zL, zR, a, xbar, b, fs, z_c, c, offset, d, p, text4, text5, A, B, e, list1. Suitable for high school and above, focusing on practical applications of statistical inference.
GeoGebra Commands & Parameters
Normal(miH, stderr, x) → fInverseNormal(miH, stderr, alfa / tailn) → zLInverseNormal(miH, stderr, 1 - alfa / tailn) → zRIntegral(f, zL, zR) → aNormal(0, 1, x) → fsInverseNormal(0, 1, alfa / tailn) → z_cIntegral(fs, z_c, -z_c) → cNormal(0, 1, x, true) → pZMeanTest(xbar, sig, n, miH, "!=") → list1
AI Drawing Prompt Reference
Draw a hypothesis testing diagram: first plot a normal distribution curve centered at the population mean with standard deviation equal to the standard error, and mark vertical lines at the critical values on both sides, shading the area between them as the acceptance region. Then overlay a standard normal distribution curve with symmetric critical values and shade its central region. Finally, add a vertical line for the sample mean and indicate the test statistic position, with text labels for significance level, sample size, standard deviation, and conclusion hints.
The prompt above was compiled from the original drawing commands and is for reference only.