
Type I Errors in Hypothesis Testing
Loading the math board and drawing, please wait…
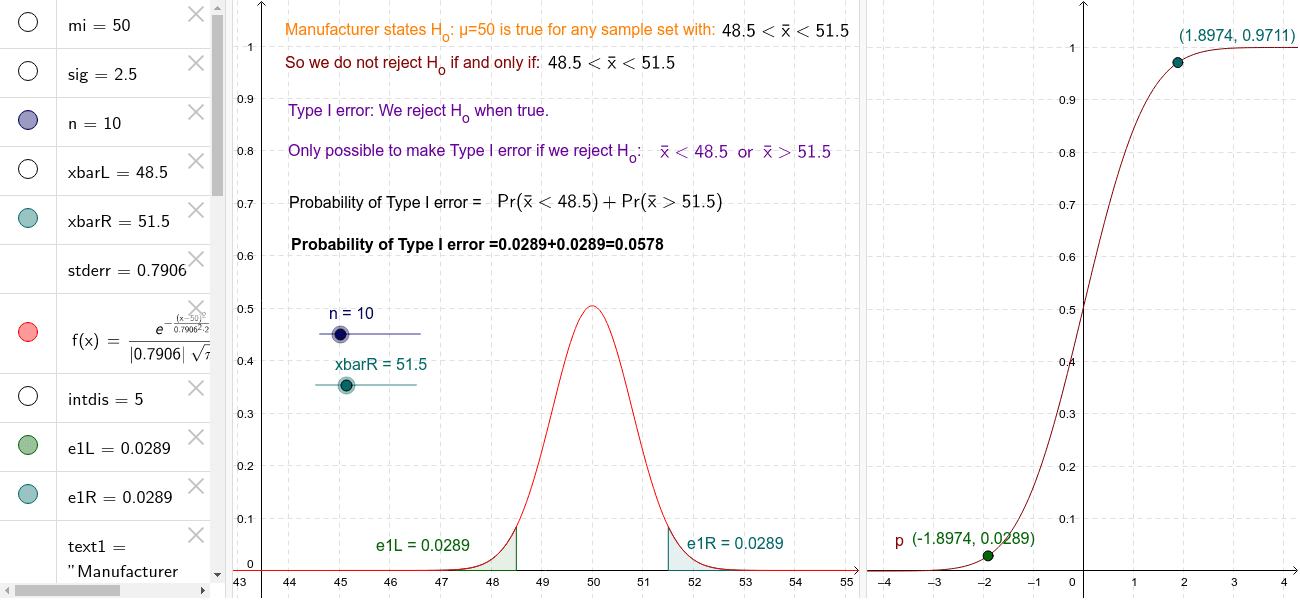
This example demonstrates Type I errors in hypothesis testing through specific contexts and standardized forms. It covers core mathematical concepts such as probability and statistics. Using GeoGebra commands like Normal and Integral, the process of hypothesis testing is dynamically illustrated. Suitable for high school and above students.
GeoGebra Commands & Parameters
Normal(50, stderr, x) → fIntegral(f, mi - intdis, xbarL) → e1LIntegral(f, xbarR, mi + intdis) → e1RNormal(0, 1, x, true) → p
AI Drawing Prompt Reference
Draw a normal distribution curve with mean 50 and standard error stderr. Then shade two areas under the curve representing integrals from mi-intdis to xbarL and from xbarR to mi+intdis. Finally, draw a standard normal distribution curve with mean 0 and standard deviation 1.
The prompt above was compiled from the original drawing commands and is for reference only.