
T-Test with Two Samples of Different Variances
Loading the math board and drawing, please wait…
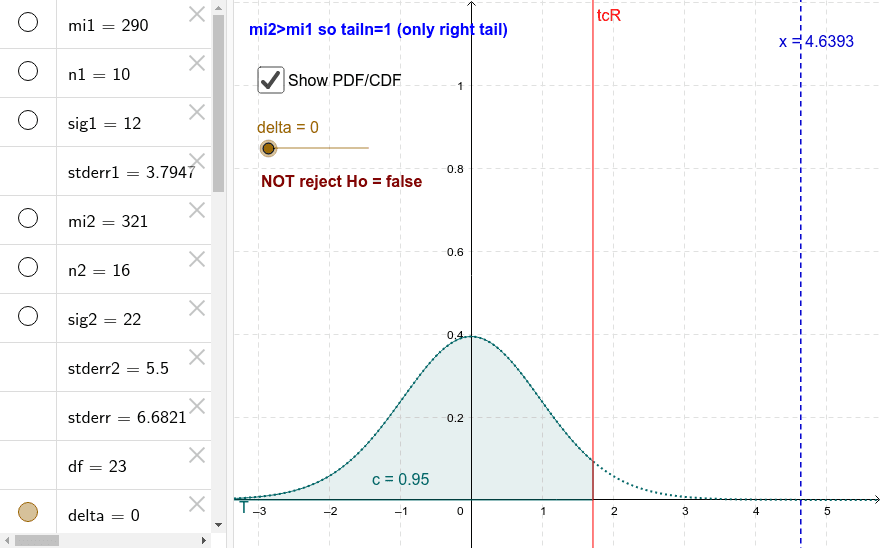
This example demonstrates a T-test for two samples with different variances. Key mathematical concepts include hypothesis testing, T-distribution, and degrees of freedom. Using the GeoGebra commands from the construction summary, one can observe how to calculate sample means, standard errors, T-values, and P-values. Suitable for statistics and probability courses.
GeoGebra Commands & Parameters
TDistribution(df, x) → TInverseTDistribution(df, If[tailn ≠ 1, alfa / abs(tailn), 1.0E-5]) → tcLInverseTDistribution(df, If[tailn > 0, 1 - alfa / tailn, 0.99999]) → tcRIntegral(T, tcL, tcR) → cTDistribution(df, x, true) → p
AI Drawing Prompt Reference
Create a T-test graph for two samples with different variances. First, calculate the means of the two samples, then compute the standard errors, followed by the T-values and P-values, and finally plot the T-distribution curve, marking the area corresponding to the P-value for the T-values.
The prompt above was compiled from the original drawing commands and is for reference only.