
Hypothesis Test Chooser
Loading the math board and drawing, please wait…
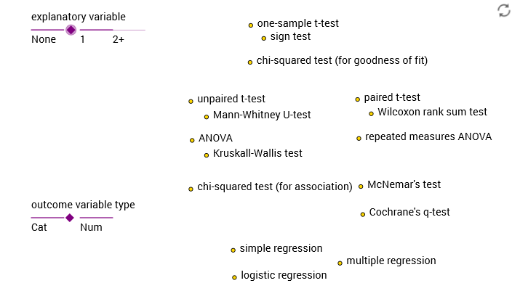
This example demonstrates how to choose the appropriate hypothesis test method. It covers core statistical concepts such as hypothesis testing, median value, and statistical characteristics. Using GeoGebra commands like Point, Text, and Segment, users can visually understand the process of hypothesis testing. Suitable for statistics and probability courses.
GeoGebra Commands & Parameters
Point(yAxis) → L2Point(Segment[(l_1, y(L2)), (r_2, y(L2))]) → P2Point(yAxis) → L1Point(Segment[(l_1, y(L1)), (f_2, y(L1))]) → P1Text(B2, A2 + testnameoffset) → C2Text(B3, A3 + testnameoffset) → C3Text(B6, A6 + testnameoffset) → C6Text(B7, A7 + testnameoffset) → C7Text(B8, A8 + testnameoffset) → C8Text(B10, A10 + testnameoffset) → C10Text(B11, A11 + testnameoffset) → C11Text(B12, A12 + testnameoffset) → C12Text(B13, A13 + testnameoffset) → C13Text(B14, A14 + testnameoffset) → C14Text(B1, A1 + testnameoffset) → C1Text(B4, A4 + testnameoffset) → C4Text(B15, A15 + testnameoffset) → C15Segment((l_1, y(L1)), (l_2, y(L1))) → M1Segment((r_1, y(L1)), (r_2, y(L1))) → N1Point(yAxis) → L3Segment((l_1, y(L2)), (l_2, y(L2))) → M2Segment((r_1, y(L2)), (r_2, y(L2))) → N2Segment((l_1, y(L3)), (l_2, y(L3))) → M3Point(yAxis) → L4Segment((r_1, y(L3)), (r_2, y(L3))) → N3Segment((l_1, y(L4)), (l_2, y(L4))) → M4Segment((r_1, y(L4)), (r_2, y(L4))) → N4Point(yAxis) → L5Segment((l_1, y(L5)), (l_2, y(L5))) → M5Segment((r_1, y(L5)), (r_2, y(L5))) → N5Text(K1, L1 + titleoffset) → Q1Text(K2, L2 + titleoffset) → Q2Text(K3, L3 + titleoffset) → Q3Text(K5, L5 + titleoffset) → Q5Text("Cat", L2 + llabeloffset) → R2Text("Cat", L3 + llabeloffset) → R3Text("2", L4 + llabeloffset) → R4Text("Norm", L5 + llabeloffset) → R5Text("Num", L2 + rlabeloffset) → S2Text("Num", L3 + rlabeloffset) → S3Text("3+", L4 + rlabeloffset) → S4Text("Nonnorm", L5 + rlabeloffset) → S5Text(K4, L4 + titleoffset) → Q4Point(Segment[(l_1, y(L3)), (r_2, y(L3))]) → P3Point(Segment[(l_1, y(L4)), (r_2, y(L4))]) → P4Point(Segment[(l_1, y(L5)), (r_2, y(L5))]) → P5Text(B5, A5 + testnameoffset) → C5Segment((f_1, y(L1)), (f_2, y(L1))) → O1Text("2+", L1 + flabeloffset) → T1Text("None", L1 + llabeloffset) → R1Text("1", L1 + rlabeloffset) → S1Text(B16, A16 + testnameoffset) → C16Point(yAxis) → L6Segment((l_1, y(L6)), (l_2, y(L6))) → M6Segment((r_1, y(L6)), (r_2, y(L6))) → N6Point(Segment[(l_1, y(L6)), (r_2, y(L6))]) → P6Text(K6, L6 + titleoffset) → Q6Text("Group", L6 + llabeloffset) → R6Text("Repeat", L6 + rlabeloffset) → S6Text(B9, A9 + testnameoffset) → C9
AI Drawing Prompt Reference
Draw a coordinate system with five points L1 to L5 on the y-axis representing different types of hypothesis tests. Draw two vertical lines M1 and N1 between L1 and L2, M2 and N2 between L2 and L3, M3 between L3 and L4, and M4 and N4 between L4 and L5. Place titles Q1, Q2, Q3, Q4, and Q5 above L1, L2, L3, L4, and L5 with contents 'Cat', 'Cat', '2', 'Norm', and 'Num', respectively. Place texts R2 and R3 to the right of L2 and L3 with content 'Cat', and text S4 to the right of L4 with content '3+'. Place text S5 to the right of L5 with content 'Nonnorm'. Place points P3, P4, and P5 on L3, L4, and L5, and place texts Q1, Q2, Q3, Q4, and Q5 to the left of L1, L2, L3, L4, and L5 with contents 'Cat', 'Cat', '2', 'Norm', and 'Num', respectively.
The prompt above was compiled from the original drawing commands and is for reference only.