
Hypergeometric Distribution and Linear Programming with Dynamic Sphere
Loading the math board and drawing, please wait…
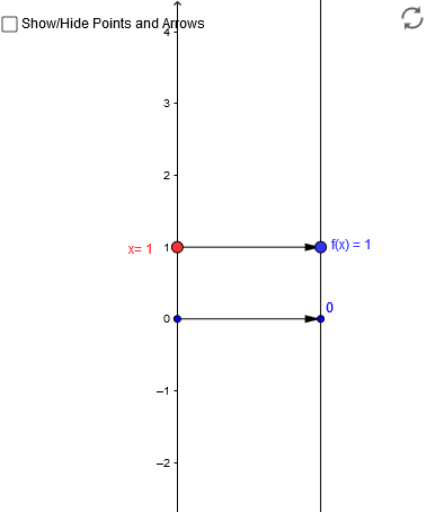
①This GeoGebra example demonstrates an interactive visualization combining hypergeometric distribution, linear programming (or linear optimization), and a spherical geometric context. ②Core mathematical concepts include hypergeometric distribution (probability of drawing without replacement from a finite population), linear programming (optimizing an objective under constraints), real-valued functions and sequences, and the sphere as a 3D geometric object. ③Construction highlights: commands such as Point, Vector, Textfield, and Sequence are used to create points, vectors, text input fields, and sequences; objects include multiple points (A, B, A1~A10, B1~B10), function f, vector u, texts text1/text2, input box inputBox1, lists list1~list3, and variables x_0, f_x; sequences generate large point sets, and sliders or input boxes allow parameter adjustment for dynamic visualization. ④Suitable for high school to university-level mathematics education, especially for interdisciplinary exploration combining probability statistics, linear programming, and geometry; useful for teacher demonstrations or student self-study to investigate how hypergeometric distribution parameters affect outcomes.
GeoGebra Commands & Parameters
Point(yAxis) → AVector(A, B) → uTextfield(f) → inputBox1Sequence(Vector[(0, i), (2, f(i))], i, -4, 4, 1) → list2Sequence((i, f(i)), i, -4, 4, 1) → list3Vector((0, 0), (2, 0)) → v