
Exercise 5: Integrated Exploration of Random Triangles, Geometric Mean, and More
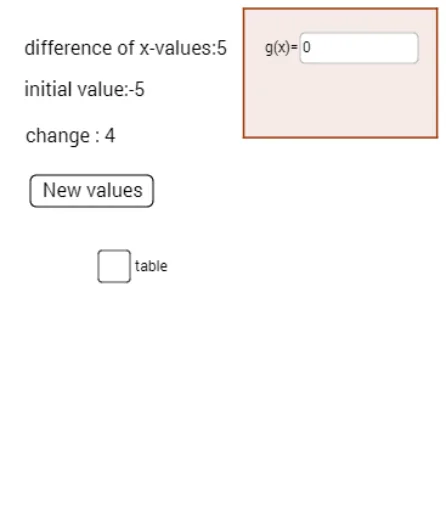
Loading the math board and drawing, please wait…
This GeoGebra example is a comprehensive exercise demonstrating the interplay between randomly generated scalene triangles, geometric mean, exponential functions, cylinders, and bar charts. The core mathematical concepts include properties of scalene triangles, computation of geometric means, behavior of exponential functions, volume or surface area of cylinders in solid geometry, and data representation via bar graphs. The construction utilizes commands such as Random, Line, Polygon, Textfield, Sequence, TableText, and InputBox to create interactive elements, along with numerous point objects (A1 to A22) for labeling or tracking. It is suitable for high school or early college students as a cross-topic practice, fostering understanding of connections among algebra, geometry, and statistics, and enhancing skills in dynamic exploration and data analysis with GeoGebra.
GeoGebra Commands & Parameters
Random(1, 8) → deltax_1Random(-5, 5) → deltay_1Random(-10, 10) → intersectyRandom(-10, 10) → n_1Line(B, A) → aTextfield(deltay) → InputBox2Random(-5, 5) → mRandom(-10, 10) → nTextfield(b) → InputBox3Sequence(Segment[A + ((deltax_1 * (i + 1)), (deltay_1 * i)), A + ((deltax_1 * (i + 1)), (deltay_1 * (i + 1)))], i, -20, 20) → risesSequence(Segment[A + ((deltax_1 * i), (deltay_1 * i)), A + ((deltax_1 * (i + 1)), (deltay_1 * i))], i, -20, 20) → runsSequence(((deltax_1 * i), intersecty + (deltay_1 * i)), i, -20, 20) → list1Textfield(g) → InputBox1TableText({{p, k, l, k_1, l_1}, {A2, B2, C2, D2, E2}, {A3, B3, C3, D3, E3}, {A4, B4, C4, D4, E4}, {A5, B5, C5, D5, E5}, {A6, B6, C6, D6, E6}, {A7, B7, C7, D7, E7}, {A8, B8, C8, D8, E8}}, "|_r") → text2Polygon(C, D, E, F) → poly1, c_1, d, e, f_1
AI Drawing Prompt Reference
Draw a random scalene triangle and calculate its geometric mean. Then, plot an exponential function graph using one side of the triangle as the base, and add a randomly generated point. Finally, use these points to create a series of line segments forming a cylinder, and represent the cylinder's volume with a bar chart.
The prompt above was compiled from the original drawing commands and is for reference only.