
Clear View: Team A with Stepwise Geometry and Function Insight
Loading the math board and drawing, please wait…
In collections
The Treehouse-Projekt - Team Architects
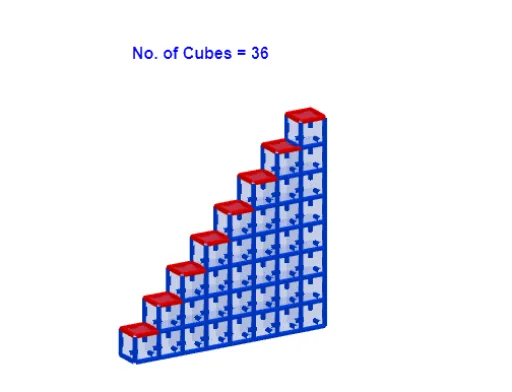
This example demonstrates a “stepwise” construction where a sequence of geometric segments is built and visually linked to function-related behavior and statistical summaries. It emphasizes how geometric relationships (including right triangles and general triangles) can be connected to functions and to quantitative descriptors that resemble statistical measures. The key concepts include triangle geometry, functional representation (potentially piecewise or parameter-driven), and the intuition behind statistical indicators. Construction-wise, it is driven by GeoGebra commands such as Sequence (to generate the Steps sequence and related points/parameters) and Segment (to create the line segments l1, l2, l3 and the geometric backbone). A rich set of labeled points (e.g., A1–A11, B2–B11, plus A, B, C, …, G) and function objects f, g are used together with range parameters (xmin, xmax) and auxiliary variables (c, h, i) to coordinate the visualization. Suitable for advanced middle school through introductory university use, especially for classroom demonstrations and for learning structured geometric construction with software.
GeoGebra Commands & Parameters
Sequence(Sequence[Cube[(i - 1, 0, k), (i, 0, k), (i, 0, k + 1)], k, 0, i - 1], i, 1, Steps) → l2, {{1}, {1, 1}, {1, 1, 1}, {1, 1, 1, 1}, {1, 1, 1, 1, 1}, {1, 1, 1, 1, 1, 1}, {1, 1, 1, 1, 1, 1, 1}, {1, 1, 1, 1, 1, 1, 1, 1}}Sequence(Polygon[(i - 1, 0, i), (i - 1, -1, i), (i, -1, i), (i, 0, i)], i, 1, Steps) → l1Sequence((i, (0.5 * (i^(2) + i))), i, 1, Steps) → l3Segment((0, y(Element[l3, Steps])), Element[l3, Steps]) → fSegment((Steps, 0), Element[l3, Steps]) → gSegment((0, 0), (0, y(Element[l3, Steps]))) → hSegment((0, 0), (Steps, 0)) → i
AI Drawing Prompt Reference
Draw a sequence of geometric line segments starting from the origin and extending outward, connected to a curve representing functional behavior. Include vertical and horizontal line segments from the origin to the endpoints of the segments to illustrate statistical indicators. The image should feature multiple triangles that relate to the function curve and statistical indicators, demonstrating how geometric relationships connect to functions and statistical descriptions.
The prompt above was compiled from the original drawing commands and is for reference only.