
GeoGebra Dynamic Exploration of Parabolas, Definite Integrals & Optimization
Loading the math board and drawing, please wait…
In collections
The Treehouse-Projekt - Team Architects
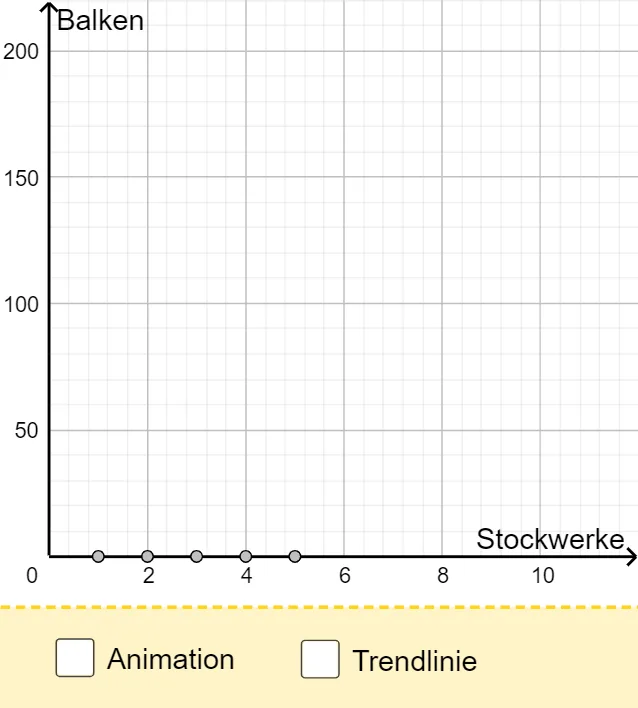
This GeoGebra example dynamically explores the relationship between parabolic curves, definite integrals, and optimization (extremum) problems. Through a structured construction involving points A1–A6, B2–B6, line segments, and animated variables such as anim, yanmi, and yanma, users can visualize how the area under a parabola changes, how limits govern convergence, and how complex numbers intersect with parabolic properties. The build extensively employs GeoGebra commands like Sequence and Segment to generate point and line arrangements, while animated parameters enable real-time motion and locus tracing. It is well-suited for high school advanced mathematics, calculus introduction, or mathematical modeling enthusiasts seeking an intuitive understanding of integral behavior and geometric optimization.
GeoGebra Commands & Parameters
Sequence((i, i), i, 0, Stockwerke) → l2Sequence(((2 * Stockwerke) - i + 1, i - 1), i, 1, Stockwerke) → l3Sequence(Segment[Element[l2, k], Element[l3, k]], k, 1, Stockwerke) → l4Sequence(((2 * i), 0), i, 1, Stockwerke - 1) → l8Sequence(Segment[Element[l2, k + 1], Element[l8, k]], k, 1, Stockwerke) → l9Sequence(Segment[Element[l3, Stockwerke - k], Element[l8, k + 1]], k, 0, Stockwerke - 2) → l10Segment(Element[l2, 1], Element[l2, Stockwerke + 1]) → gSegment(Element[l2, Stockwerke + 1], Element[l3, 1]) → hSegment((0, 0), (Stockwerke, 0)) → h1Segment((0, 0), (0, Karten)) → h2Segment((Stockwerke, 0), P) → h3Segment((0, Karten), P) → h4
AI Drawing Prompt Reference
Draw a dynamic graphic that explores the relationship between parabolic curves, definite integrals, and optimization problems. The graphic should include points A1 to A6 and points B2 to B6, along with line segments. Animated variables such as anim and yanmi can control the motion of the graphic. Construct these points, line segments, and animated parameters to visualize how the area under a parabola changes, how limits govern convergence, and how complex numbers intersect with parabolic properties. The construction order should start from points, then line segments, and finally animated parameters, to intuitively understand integral behavior and geometric optimization.
The prompt above was compiled from the original drawing commands and is for reference only.