
Hyperbola Eccentricity Interactive Demo
Loading the math board and drawing, please wait…
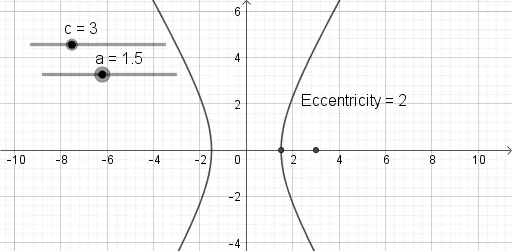
①This GeoGebra example dynamically demonstrates the eccentricity of a hyperbola, showing how changing eccentricity alters the shape of the curve. ②Core mathematical concepts include the definition of eccentricity (e = c/a, ratio of focal distance to semi-transverse axis), which controls the openness of the hyperbola, along with standard equation, foci, vertices, and asymptotes. ③Construction details: Based on the summary, objects include c (likely focal distance or curve), a (semi-transverse axis), A, B (vertices or foci), d (possibly asymptote or distance), e (eccentricity value), and text1 (text display). Parameters are adjusted via sliders or inputs, updating the graph and numerical readout in real time. ④Suitable for high school analytic geometry or college conic sections courses, useful for teachers demonstrating the relationship between eccentricity and hyperbola shape, or for students' self-directed exploration.
GeoGebra Commands & Parameters
Numeric c(3.0)Numeric a(1.5)(c, 0)(a, 0)x^(2) / a^(2) - y^(2) / (c^(2) - a^(2)) = 1c / a
AI Drawing Prompt Reference
Draw an interactive hyperbola demonstration showing how eccentricity affects the curve shape. Include a standard hyperbola defined by semi-transverse axis and focal distance, with two sliders to adjust these parameters. Place two foci on the x-axis and vertices at the transverse axis endpoints. Show asymptotes that change slope with parameters. Display the current eccentricity value as text, computed as focal distance divided by semi-transverse axis. As sliders move, the hyperbola's openness and asymptote slopes update, illustrating that larger eccentricity produces a wider curve.
The prompt above was compiled from the original drawing commands and is for reference only.