
Hyperbola Construction: Asymptotes, Ellipse Reference, and Slope/Angle Features
Loading the math board and drawing, please wait…
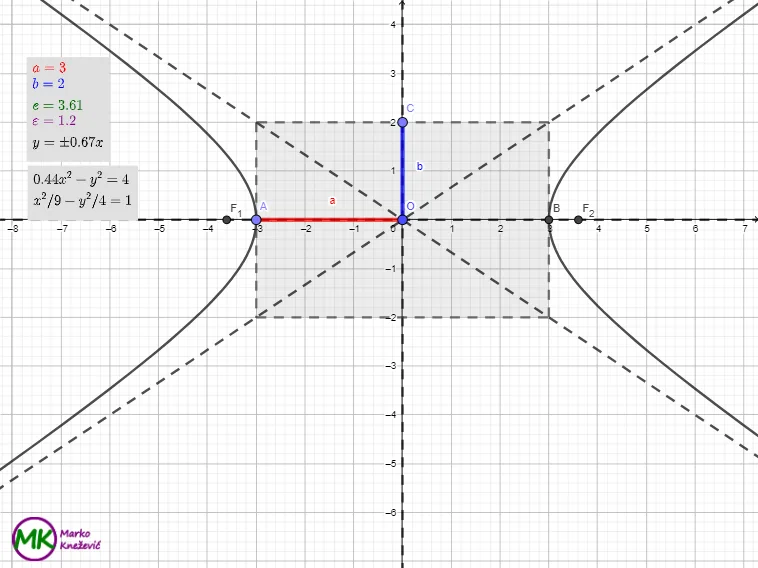
This GeoGebra example demonstrates how to construct and examine a hyperbola by visualizing its core geometric components—such as the major/minor axes, foci, and asymptotes—and then using slope and orthogonal-line constructions to highlight angle-related properties. Key mathematics includes the hyperbola’s standard geometric definition (axes, focus structure), curve sketching principles, and line/angle relationships expressed via slope. Construction workflow: it uses Line, Point, and Segment to define lines and key points in the plane; Ellipse as a reference shape, together with Intersect to compute important intersection points; Asymptote to generate the hyperbola’s asymptotes; OrthogonalLine to draw perpendicular helper lines; Polygon for organizing the visual sketch; and Slope to compute/display slope information. Various objects (e.g., foci F_1/F_2 and parameters a, b, c, e, p, q) and labels are used to make the relationship between parameters and geometry explicit. Suitable for high school through early university study, especially for coordinate geometry, geometric construction, and interactive graphing of conic sections.
GeoGebra Commands & Parameters
Line(O, xAxis) → largeAxisLine(O, yAxis) → smallAxisPoint(largeAxis) → APoint(smallAxis) → CSegment(O, A) → aSegment(O, C) → bEllipse(F_1, F_2, a) → cIntersect(c, smallAxis, 1) → DIntersect(c, largeAxis, 2) → BAsymptote(c) → f, gOrthogonalLine(B, largeAxis) → hOrthogonalLine(A, largeAxis) → iIntersect(g, i) → EIntersect(f, i) → FIntersect(g, h) → GIntersect(f, h) → HPolygon(E, F, G, H) → q1, e_1, f_1, g_1, h_1Slope(f) → slope
AI Drawing Prompt Reference
Draw a hyperbola centered at the origin with two perpendicular axes as reference lines. Mark a vertex on the horizontal axis and a point on the vertical axis, connecting each to the origin with a segment. Using two foci and the length of the horizontal segment, construct an auxiliary ellipse and find its intersections with the axes. Then draw the hyperbola's two asymptotes. From the horizontal-axis intersection point, draw a perpendicular line that meets the asymptotes at four points; connect these points to form a rectangle. Finally, display the slope of one asymptote and indicate the associated angle relationships.
The prompt above was compiled from the original drawing commands and is for reference only.