
How to Graph the Median-Median Line
Loading the math board and drawing, please wait…
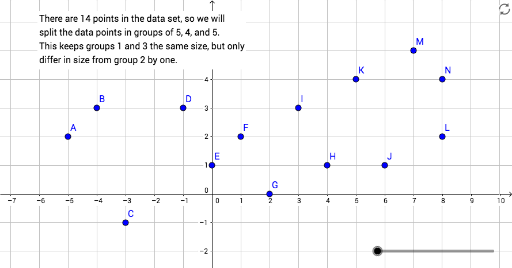
This example demonstrates how to fit a data set using the Median-Median Line method. Key mathematical concepts include median, convex hull, centroid, and linear regression. GeoGebra commands like Sort, Length, Take, ConvexHull, Centroid, and Line are used to construct the line. Suitable for high school students and educational purposes requiring data fitting techniques.
GeoGebra Commands & Parameters
Sort({A, B, C, D, E, F, G, H, I, J, K, L, M, N}) → dataLength(data) → aTake(data, 1, b) → list1Take(data, b + 1, a - b) → list2Take(data, a - b + 1, a) → list3ConvexHull(list1) → graph1ConvexHull(list2) → graph2ConvexHull(list3) → graph3Sort({P, Q, O}) → list4ConvexHull(list4) → graph4Centroid(Polygon[list4]) → RLine(R, Line[Element[list4, 1], Element[list4, 3]]) → MedMed
AI Drawing Prompt Reference
Draw a graph showing how to fit a dataset using the Median-Median Line method, highlighting median, convex hull, centroid, and linear regression. Sort the data points into three groups, draw convex hulls for each group, find the convex hull and centroid of a specific set of points, and finally draw the median line through the centroid and a side of the convex hull.
The prompt above was compiled from the original drawing commands and is for reference only.