
How Data Transformations Affect Mean and Standard Deviation
Loading the math board and drawing, please wait…
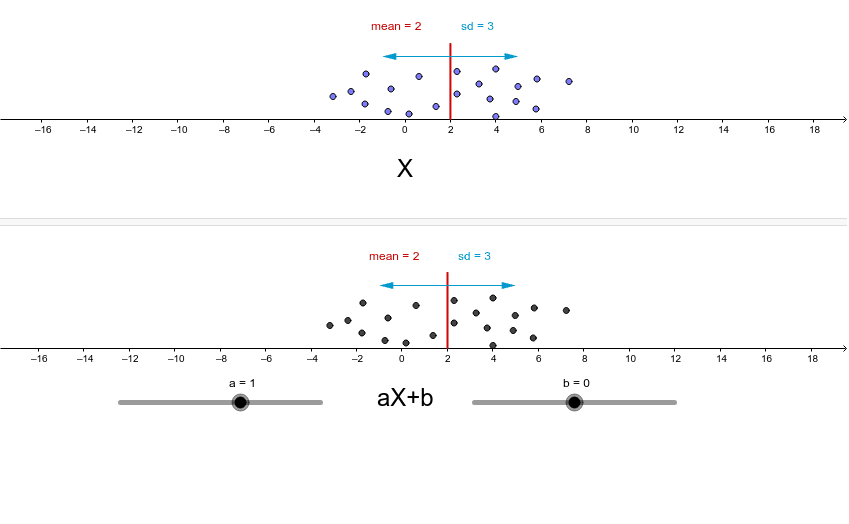
This example demonstrates how moving data points affects the mean and standard deviation. By dragging the points, you can observe the changes in the data distribution. Key mathematical concepts include mean, standard deviation, and data transformations. The construction uses GeoGebra commands such as Point, Mean, SD, Segment, and Vector. Suitable for high school mathematics education and learning probability and statistics.
GeoGebra Commands & Parameters
Point(C1) → D1Point(C2) → D2Point(C3) → D3Point(C4) → D4Point(C5) → D5Point(C6) → D6Point(C7) → D7Point(C8) → D8Point(C9) → D9Point(C10) → D10Point(C11) → D11Point(C12) → D12Point(C13) → D13Point(C14) → D14Point(C15) → D15Point(C16) → D16Point(C17) → D17Point(C18) → D18Point(C19) → D19Point(C20) → D20Mean(E1:E20) → muSD(E1:E20) → stdevSegment((mu1, 0), (mu1, (h * 30))) → dSegment((mu, 0), (mu, (h * 30))) → cVector((mu, (h * 25)), (mu + stdev, (h * 25))) → uVector((mu, (h * 25)), (mu - stdev, (h * 25))) → vVector((mu1, (h * 25)), (mu1 + stdev1, (h * 25))) → wVector((mu1, (h * 25)), (mu1 - stdev1, (h * 25))) → e
AI Drawing Prompt Reference
Draw 20 draggable points, display their mean and standard deviation, use line segments to represent the mean, and vectors to represent the standard deviation, observe how the mean and standard deviation change as the data points move, first draw the mean and standard deviation of the original data, then draw the mean and standard deviation after changes, and visualize these statistics with line segments and vectors.
The prompt above was compiled from the original drawing commands and is for reference only.