
How Changing Slope Affects a Linear Relation
Loading the math board and drawing, please wait…
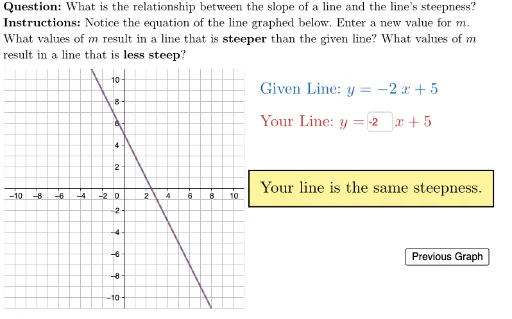
This example demonstrates how changing the slope affects a linear relation. Key mathematical concepts include linear equations. Using GeoGebra commands such as If, Textfield, Polygon, users can dynamically adjust the slope and observe changes in the linear relation. Suitable for middle school and above students to learn linear equations and geometric construction.
GeoGebra Commands & Parameters
If(isPart1, 3, -2) → givenMIf(¬isPart1, 5, 7) → givenBTextfield(textUserM) → ansBoxUserMLaTeX(("\text{Given Line: }y=" * givenLine)) → givenLineLabelIf(abs(numUserM) > abs(givenM), "steeper", If[abs(numUserM) < abs(givenM), "less steep", If[abs(numUserM) ≟ abs(givenM), "the same steepness", "invalid"]]) → resultLaTeX((("\fcolorbox{black}{#fff59d}{\text{Your line is " * result) * ".}}")) → feedbackLaTeX(("\text{Your Line: }y=\hspace{40}x+" * givenB)) → userLineLabelPolygon((-11, -11), (-11, 11), (11, 11), (11, -11)) → viewBox, f, g, h, iLaTeX("\text{\textbf{Question: }What is the relationship between the slope of a line and the line's steepness?\\\textbf{Instructions: }Notice the equation of the line graphed below. Enter a new value for \(m\).\\What values of \(m\) result in a line that is \textbf{steeper} than the given line? What values of \(m\)\\result in a line that is \textbf{less steep}?}") → TEXT
AI Drawing Prompt Reference
Draw a graph showing how changing the slope affects a linear relation. Display two lines: one with a given slope and another with a user-adjustable slope. Label the equations of both lines and compare their steepness, using a colored box to indicate whether the user's slope makes the line steeper or less steep than the given line. Include a rectangular coordinate system and text instructions at the top.
The prompt above was compiled from the original drawing commands and is for reference only.