
Horizontal and Vertical Translations of Functions
Loading the math board and drawing, please wait…
In collections
Graphing Linear Functions
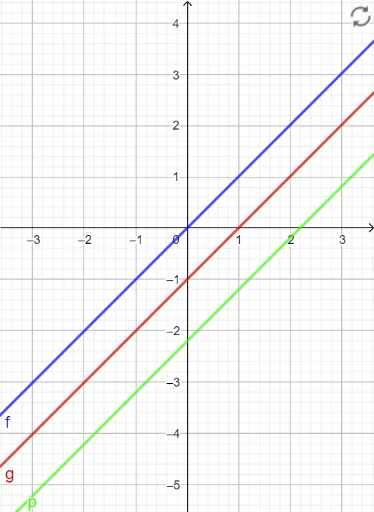
①This example demonstrates how a function's graph shifts horizontally and vertically, allowing users to visually explore the effects of translation parameters. ②The core mathematical concept is function transformation: a horizontal shift by h units yields f(x-h), and a vertical shift by k units yields f(x)+k, linking algebraic expressions to geometric movement. ③Construction: based on the summary, objects f, h, g, k, p are used; f is the original function, h and k likely represent translation amounts, while g and p are the translated graphs, created via GeoGebra's algebraic input and dynamic graphics. ④Suitable for middle and high school mathematics, particularly in function graphing and transformation units, serving as an interactive demonstration for teachers or a self-exploration tool for students to understand translation rules.
GeoGebra Commands & Parameters
f(x) = xNumeric h(1)g(x) = f(x - h)Numeric k(-2.2)p(x) = f(x) + k
AI Drawing Prompt Reference
Draw a function graph and show its horizontal and vertical translation effects. Start with a base function graph, then use two sliders to control the horizontal rightward and vertical upward translation amounts, respectively, to draw the two translated function graphs, visually demonstrating the impact of translation parameters on the function graph.
The prompt above was compiled from the original drawing commands and is for reference only.