
Rise & Run (Revamped) – Interactive Slope Exploration
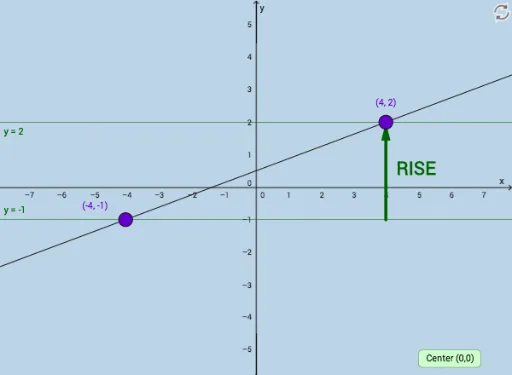
Loading the math board and drawing, please wait…
In collections
Graphing Linear Functions
This interactive GeoGebra applet visually demonstrates the geometric meaning of 'Rise' and 'Run' in the context of a line's slope, allowing students to discover that the rise equals the difference in y-coordinates and the run equals the difference in x-coordinates. Core mathematical concepts include slope, coordinate differences, right-triangle relationships, and vector components. Construction highlights: the applet uses the Line command to draw the line, Intersect to find key points, Vector to represent direction, Distance to measure segment lengths, Angle to label relevant angles, and includes dynamic text (TextCB, TextAC) and a button (button1) for interactive updates. Suitable for middle school to high school students learning coordinate geometry or graphing, and ideal for classroom demonstrations or self-guided exploration of how slope relates to coordinate differences.
GeoGebra Commands & Parameters
Line(A, B) → aIntersect(b, c) → CVector(A, C) → uVector(C, B) → vDistance(C, B) → distanceCBDistance(A, C) → distanceACAngle(B, C, A) → α
AI Drawing Prompt Reference
Draw a line with two points on it. Create vectors starting from these points to show direction. Measure the distance between the points and the length of the line segment connecting them. Label the angle between the line segment and the horizontal axis. Display the slope of the line dynamically and use a slider to explore the relationship between slope and coordinate differences, helping students understand the geometric meaning of slope.
The prompt above was compiled from the original drawing commands and is for reference only.