
Histograms and Boxplots
Loading the math board and drawing, please wait…
In collections
statistics
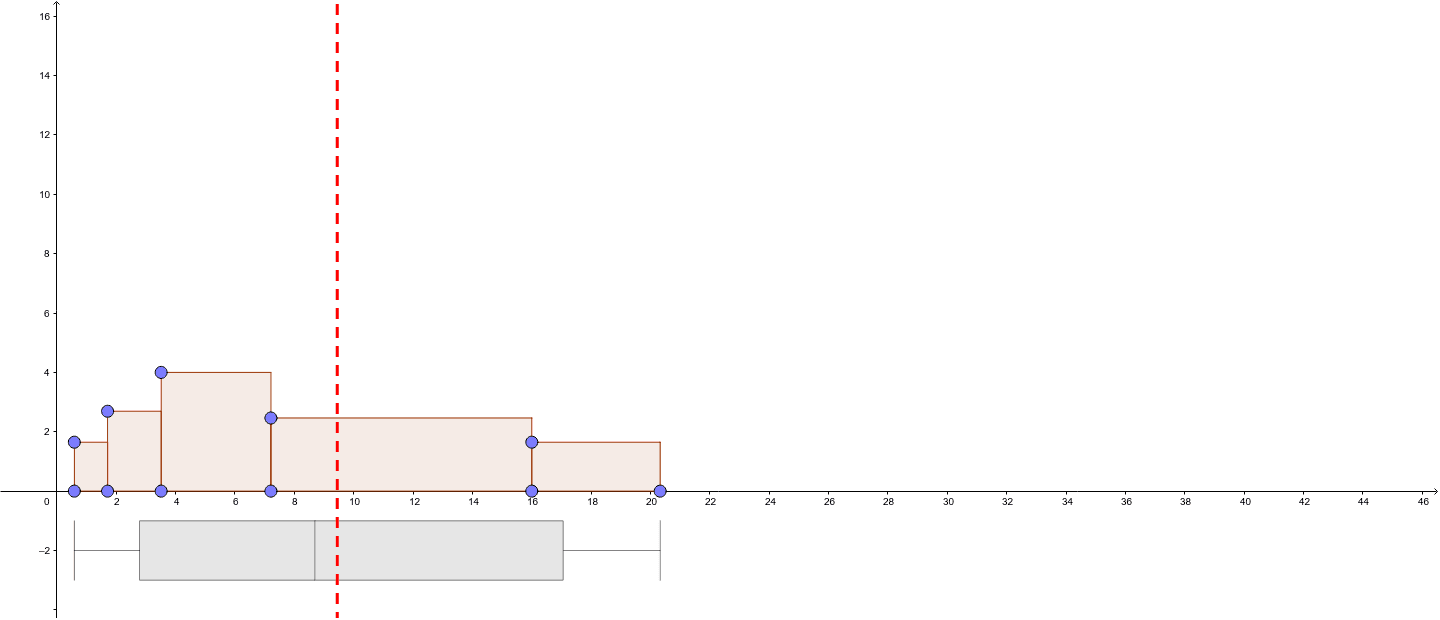
This example demonstrates the creation of histograms and boxplots. Histograms show the distribution of data, while boxplots provide a visual summary of the data's central tendency and dispersion. Commands such as Point, OrthogonalLine, Intersect, Polygon, Segment, and BoxPlot are used to construct these graphs. Suitable for middle school and above students to learn data statistics and analysis.
GeoGebra Commands & Parameters
Point(xAxis) → APoint(xAxis) → BOrthogonalLine(B, xAxis) → bPoint(b) → HOrthogonalLine(H, b) → iPoint(xAxis) → COrthogonalLine(C, xAxis) → cIntersect(c, i) → MPolygon(B, H, M, C) → poly2, b_2, h_1, m, c_1Point(c) → IOrthogonalLine(I, c) → jPoint(xAxis) → DOrthogonalLine(D, xAxis) → dIntersect(d, j) → NPolygon(C, I, N, D) → poly3, c_2, i_1, n, d_1Point(d) → JOrthogonalLine(J, d) → kPoint(xAxis) → EOrthogonalLine(E, xAxis) → eIntersect(k, e) → UPolygon(D, J, U, E) → poly4, d_2, j_1, u, e_1Point(e) → KOrthogonalLine(K, e) → lPoint(xAxis) → FOrthogonalLine(F, xAxis) → gIntersect(g, l) → VPolygon(E, K, V, F) → poly5, e_2, k_1, v, f_1OrthogonalLine(A, xAxis) → aPoint(a) → GOrthogonalLine(G, a) → hIntersect(b, h) → LPolygon(A, G, L, B) → poly1, a_1, g_1, l_1, b_1Segment((0, C1), (B1, C2)) → iseg1Segment((B1, C2), (B2, C3)) → iseg2Segment((B2, C3), (B3, C4)) → iseg3Segment((B3, C4), (B4, C5)) → iseg4Segment((B4, C5), (B5, C6)) → iseg5BoxPlot(-2, 1, A8:A12) → oSum(E1:E5) → E6
AI Drawing Prompt Reference
Create a statistical chart featuring histograms and boxplots. Draw several vertical segments perpendicular to the X-axis, mark points on them, and connect these points to form multiple rectangles representing the histogram. Below the histogram, construct a boxplot with a box, whiskers, and outliers to display data distribution and central tendency. The overall visual presents statistical data analysis.
The prompt above was compiled from the original drawing commands and is for reference only.