
Histogram with Equal Bars
Loading the math board and drawing, please wait…
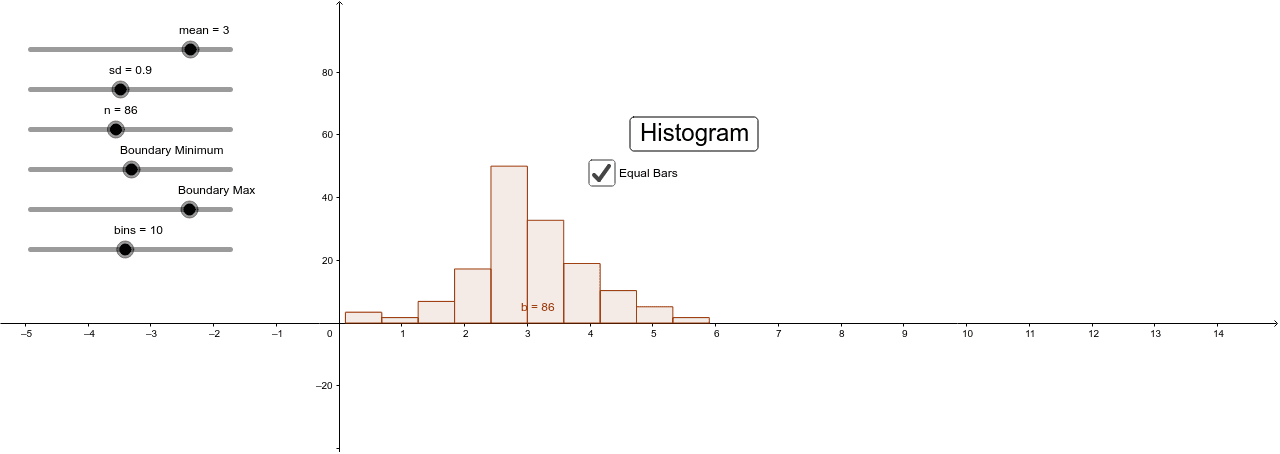
This example demonstrates the quick generation of histograms with equal bars. Students can customize mean, standard deviation, and sample size using a random normal distribution sample. The construction involves commands like Sequence and Histogram, suitable for statistics education.
GeoGebra Commands & Parameters
Sequence(Random[1, 6], m, 1, n) → list1Sequence(RandomNormal[mean, sd], i, 1, n) → valuesSequence(bmin + (i * h), i, 0, bins) → boundariesHistogram(boundaries, values, true) → b
AI Drawing Prompt Reference
Create a histogram showing data from a random normal distribution. Set the mean to 5, standard deviation to 1, and sample size to 30. The histogram should have 30 equal-width bars with a bar width of 1.
The prompt above was compiled from the original drawing commands and is for reference only.