
Comparing Pie Charts and Bar Charts
Loading the math board and drawing, please wait…
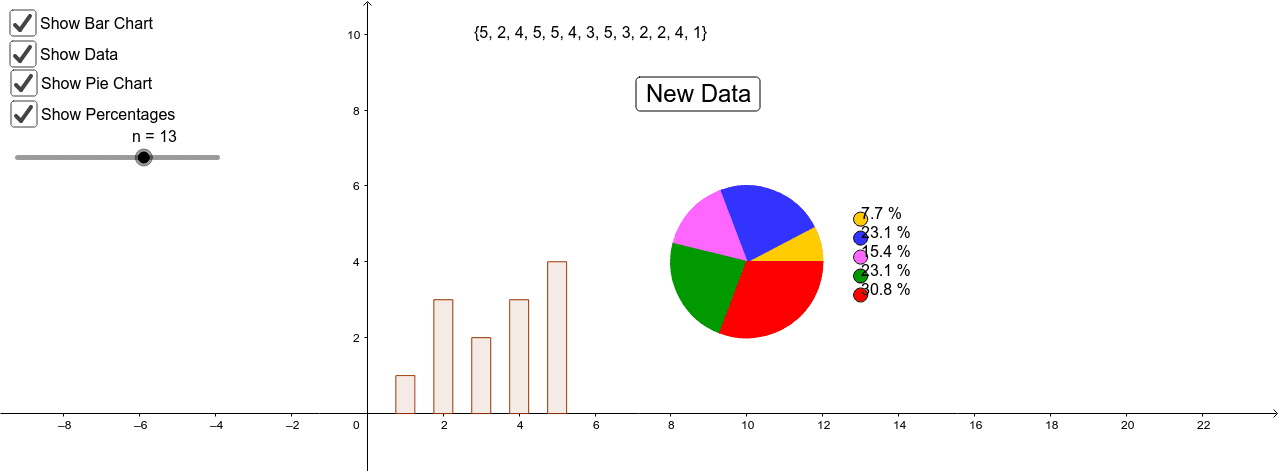
This example demonstrates how to create and compare pie charts and bar charts using GeoGebra. It involves core math concepts like data visualization in statistics and basic probability. Key GeoGebra commands/objects used include Sequence, BarChart, Pizza, and Sort for constructing the visualizations. Suitable for middle school and above, ideal for teaching data visualization techniques or student exploration.
GeoGebra Commands & Parameters
Sequence(Random[dmi, dma], i, 1, n) → dataBarChart(data, 0.5) → aPizza((10, 4), 2, data) → c, d, A, B, C, D, E, F, G, H, I, J, e, text1, text2, text3, text4, text5, text6, text7, text8, text9, text10, f, g, h, k, p, q, rSort(data) → sorted
AI Drawing Prompt Reference
Create a pie chart and a bar chart to compare data. First, generate a set of random data, then create a bar chart using this data, followed by a pie chart with the same data. Finally, sort the data.
The prompt above was compiled from the original drawing commands and is for reference only.