
Histogram - Shoplifting Data
Loading the math board and drawing, please wait…
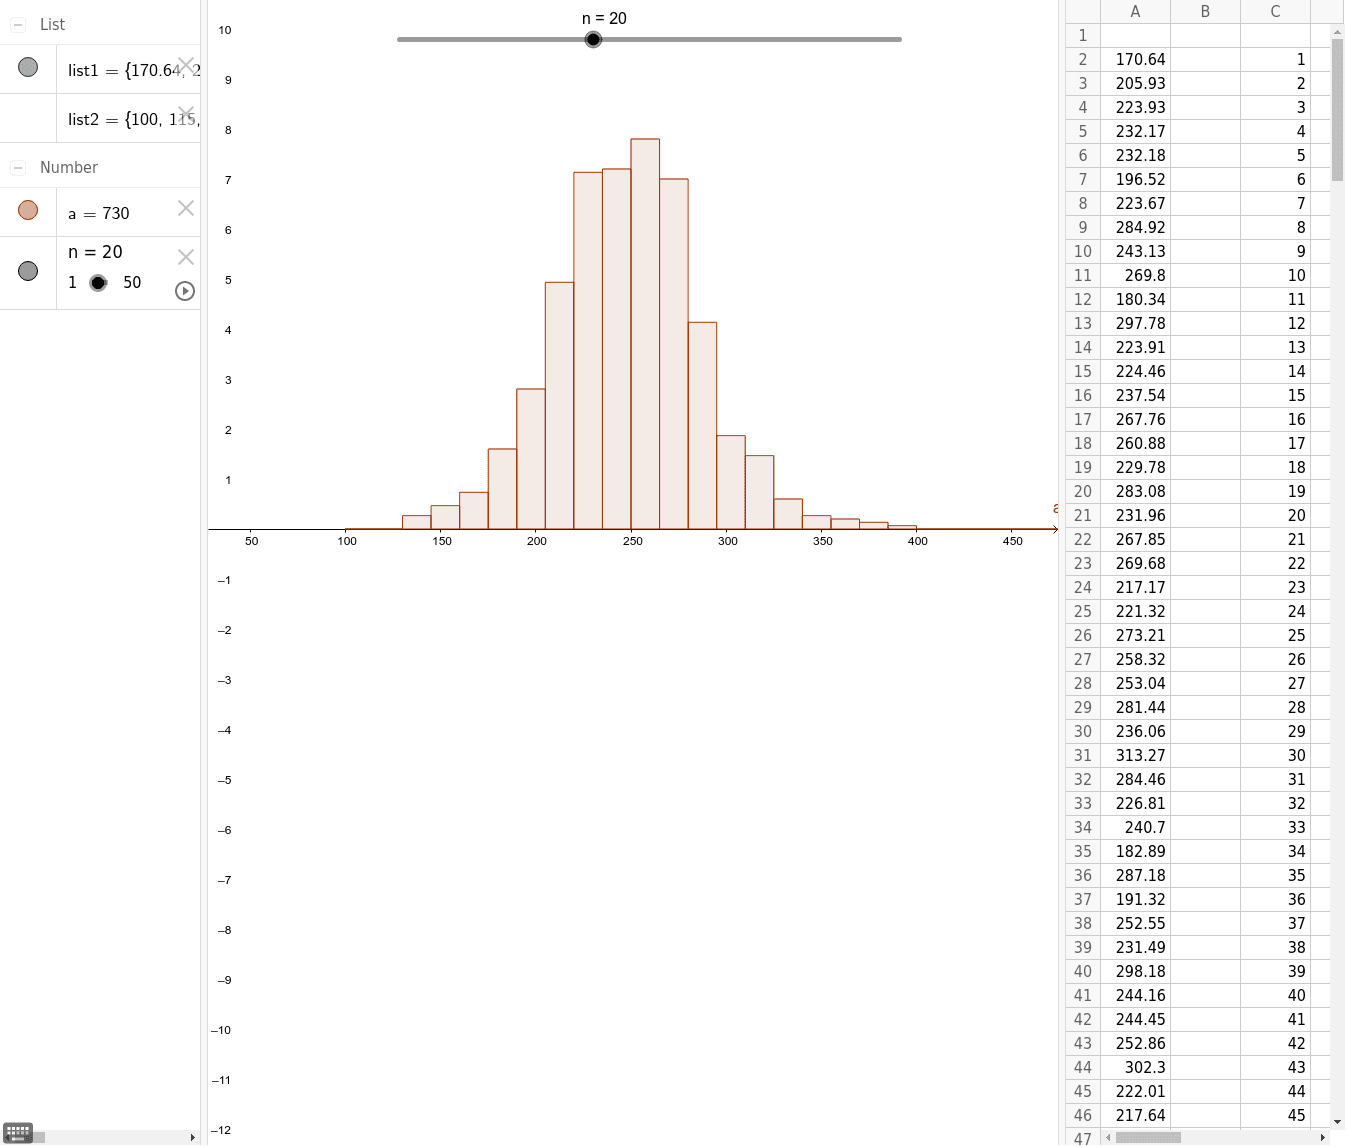
This example demonstrates how to use a histogram to visualize the distribution of shoplifting data. Core math concepts include histogram, integers, arithmetic, geometric transformations, 2D vectors, and line segments. Constructed using the GeoGebra command Histogram with objects A2 to A41. Suitable for high school mathematics teaching, focusing on probability & statistics and data analysis.
GeoGebra Commands & Parameters
Histogram(list2, list1, true, 1) → a