
Fitting a Normal Distribution to a Histogram
Loading the math board and drawing, please wait…
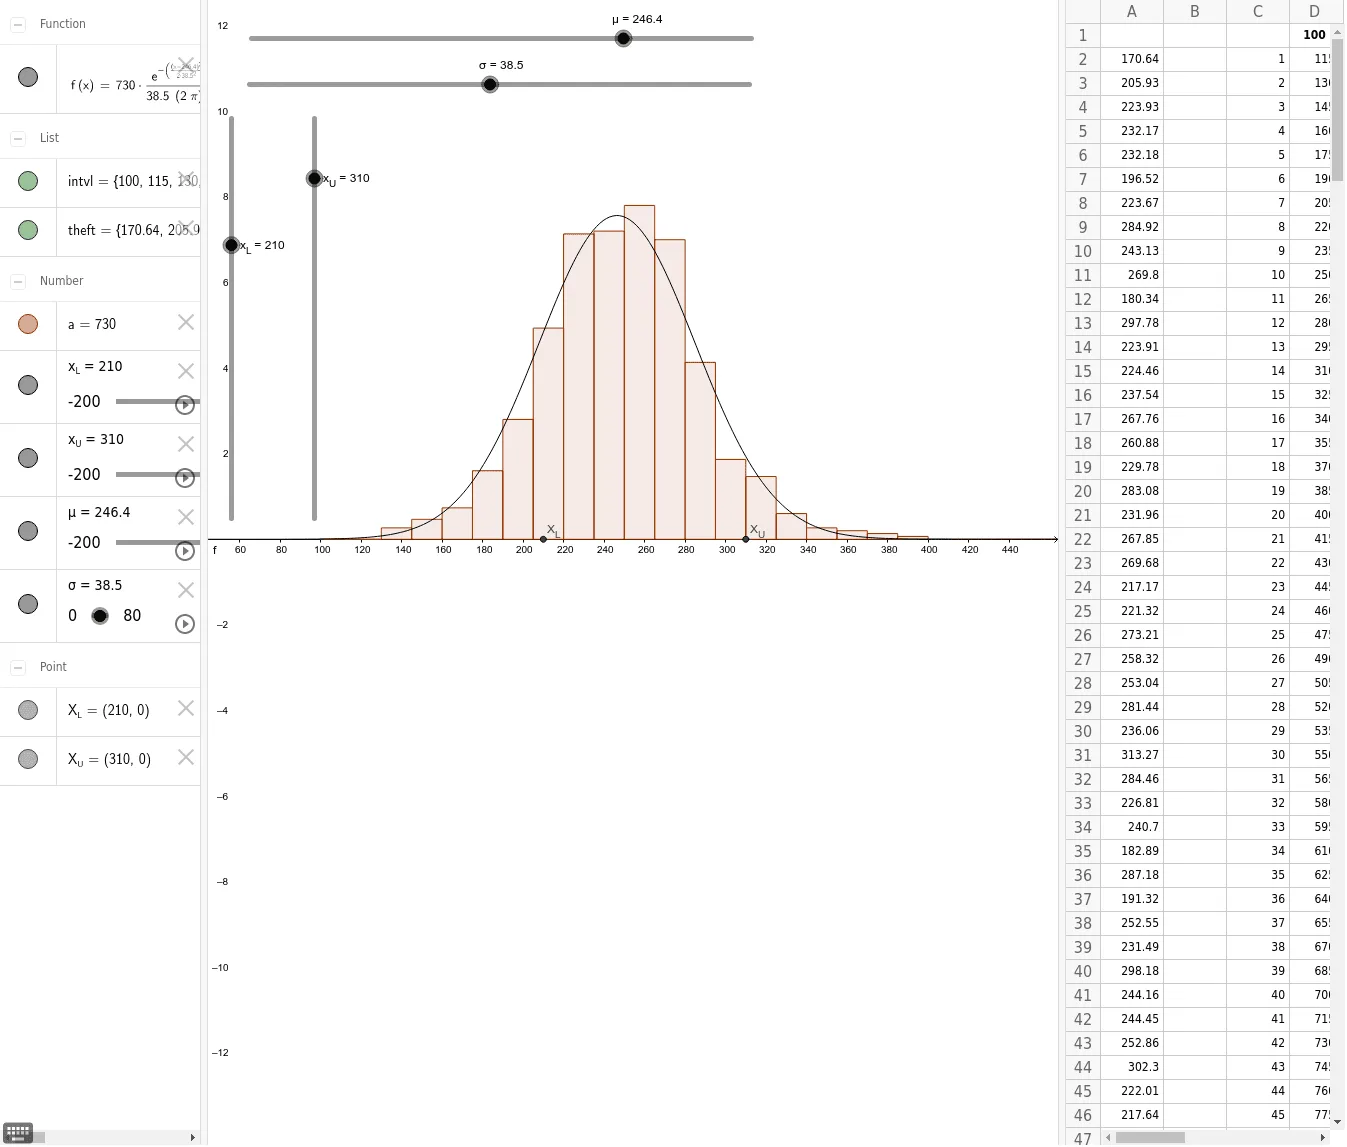
This example demonstrates how to fit a normal distribution curve to a histogram, visually showing the symmetry and central tendency of data distribution. Core math concepts include histograms, normal distributions, mean, standard deviation, and probability & statistics. Key GeoGebra commands used are Histogram, Mean, SD, and objects like μ (mean), σ (standard deviation), x_L, x_U (interval boundaries). Suitable for high school and above students learning data distribution, statistical modeling, and applications of the normal distribution.
GeoGebra Commands & Parameters
Histogram(intvl, theft, true, 1) → aMean(A1:A731) → F2SD(theft) → F3