
Histogram Bin Width Demonstration
Loading the math board and drawing, please wait…
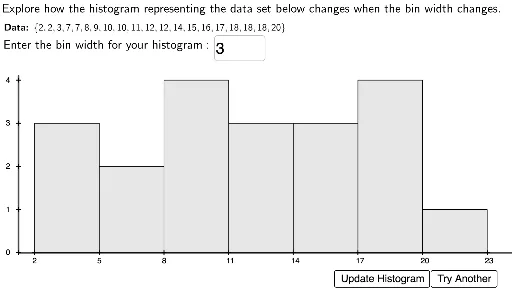
This example demonstrates how to construct a histogram from data and adjust the bin width. It involves core mathematical concepts like histograms, equations, geometric distribution, area calculation, and random experiments. Constructed using GeoGebra commands and objects such as Sort, Frequency, Element, Textfield, Sequence, Histogram, Ray, Segment, LaTeX. Suitable for high school students learning probability and statistics.
GeoGebra Commands & Parameters
Sort(Sequence[Random[20, 450] / 10, i, 1, 27]) → ValuesFrequency(Bins, Test) → FreqListElement(Test, numvals) → maxvalElement(Test, 1) → minvalTextfield(usertext) → InputBox1Sequence((i, 0), i, minval, minval + (numbins * binwidth), binwidth) → TickMarksSequence(Text[Element[Bins, i], Element[TickMarks, i] - (xlabhshift, xlabvshift)], i, 1, 100) → xLabelsSequence(0, maxy, ygap) → yValsSequence((minval - 0.75, i), i, Min[yVals], Max[yVals], ygap) → yTickMarksSequence(Text[Element[yVals, i], Element[yTickMarks, i] + (ylabhshift, ylabvshift)], i, 1, Length[yVals]) → yLabelsHistogram(Bins, Test, false) → HGramRay((minval - 0.75, 0), (100, 0)) → xaxisSegment((minval - 0.75, 0), (minval - 0.75, maxy)) → yaxisLaTeX(("\textbf{Data\text{:}}\ " * Test)) → DataText
AI Drawing Prompt Reference
Draw a histogram demonstration with a horizontal axis for data bins and a vertical axis for frequency. Generate a set of random data values and sort them. Set adjustable bin width and bin count to divide the data into intervals. Mark tick marks on the horizontal axis at regular bin-width intervals with labels for each bin. Label the vertical axis with fixed interval ticks. Represent the frequency of data in each bin with rectangular bars whose heights correspond to the counts. Add horizontal and vertical axes, and display the raw data list within the figure. The layout should clearly show how changing bin width affects the histogram shape.
The prompt above was compiled from the original drawing commands and is for reference only.