
Histogram and Frequency Polygon: Visualizing Data Distribution
Loading the math board and drawing, please wait…
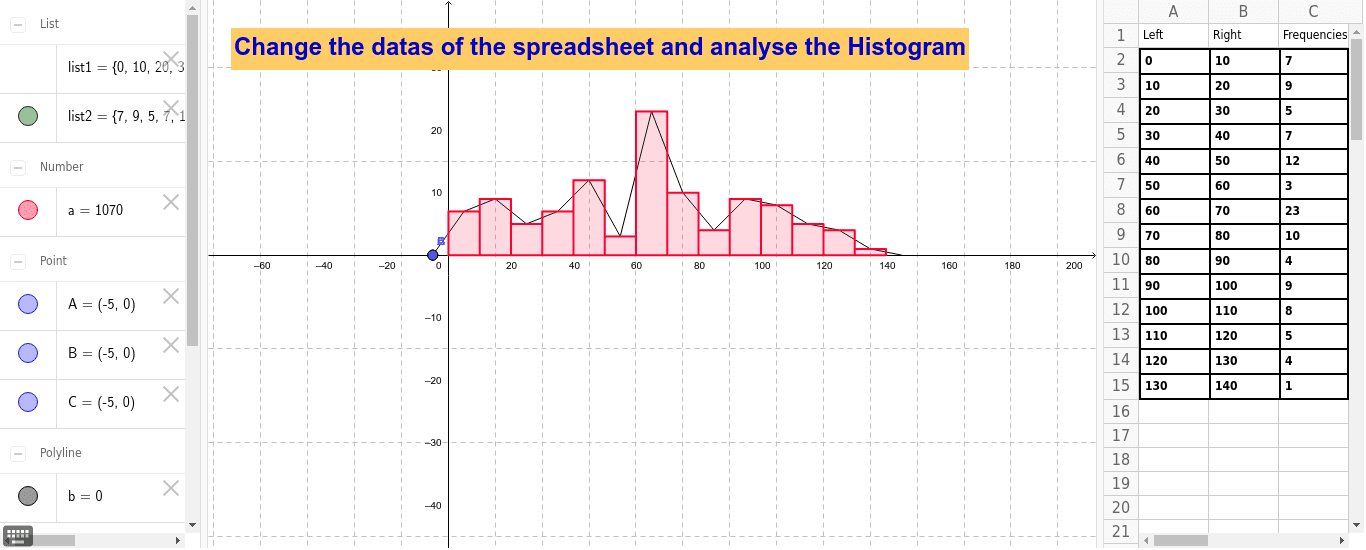
① This GeoGebra example dynamically demonstrates the construction of a histogram and its corresponding frequency polygon, showing how grouped data can be visualized to reveal distribution patterns. ② Core mathematical concepts include data binning, frequency counting, the relationship between histograms and frequency polygons, and connections to probability distributions such as the binomial distribution. ③ Construction highlights: The example uses GeoGebra commands Histogram and FrequencyPolygon, along with multiple point objects (A1–A15, B1–B8, etc.) and a list object (list2) to define class intervals and frequencies. Text objects (text1) annotate key values, while geometric shapes like rectangles and isosceles triangles help illustrate the area and shape relationships between the histogram bars and the polygon. ④ This is suitable for middle school and high school statistics lessons, as well as introductory college probability courses, providing an intuitive bridge from empirical frequency distributions to theoretical probability models.
GeoGebra Commands & Parameters
Histogram(list1, list2) → aFrequencyPolygon(list1, list2) → b
AI Drawing Prompt Reference
Draw a histogram and a frequency polygon to visualize data distribution, using multiple point objects and a list to define class intervals and frequencies, illustrating the area and shape relationships between the histogram bars and the polygon with rectangles and isosceles triangles, and adding text annotations for key values.
The prompt above was compiled from the original drawing commands and is for reference only.