
Harmonic Sequence and Series: Convergence and Divergence Visualized
Loading the math board and drawing, please wait…
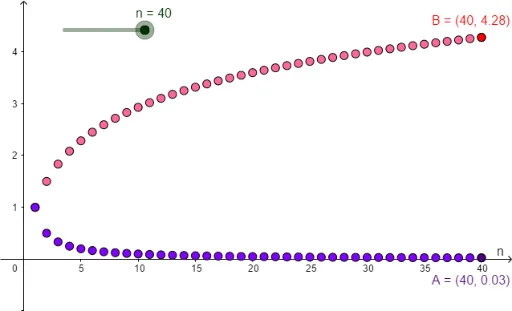
This GeoGebra example graphically demonstrates the fundamental properties of the harmonic sequence and series: the harmonic sequence (terms 1/n) converges to 0, while the harmonic series (sum of terms) diverges to infinity. The graph uses point sequences to represent the terms Sn and cumulative sums S1, clearly contrasting the convergence of the sequence with the divergence of the series. Core mathematical concepts include sequence limits, series convergence, divergence of the harmonic series, and partial sums. Construction highlights: using GeoGebra's Sequence command to generate points for sequence terms, Point command to mark key points, with objects including n (term index), Sn (nth term), S1 (partial sum), and auxiliary points A and B, allowing dynamic adjustment of n to observe trends. Suitable for high school and above when learning sequences and series, and for introductory calculus in university, helping students intuitively grasp the difference between convergence and divergence.
GeoGebra Commands & Parameters
Sequence((p, Sum[1 / m, m, 1, p]), p, 1, n, 1) → SnSequence((m, 1 / m), m, 1, n) → S1Point(S1, n) → APoint(Sn, n) → B
AI Drawing Prompt Reference
Create a dynamic graph contrasting the harmonic sequence and series. The x-axis represents the term index, and the y-axis represents values. Plot a sequence of points for the harmonic terms, which approach zero as the index increases. Simultaneously, plot another sequence of points for the partial sums, which rise without bound. Include a slider to adjust the term index, updating both point sets in sync. Highlight the current points on both sequences corresponding to the slider value, clearly showing the sequence converging while the series diverges.
The prompt above was compiled from the original drawing commands and is for reference only.