
Graphs of Exponential and Logarithmic Functions
Loading the math board and drawing, please wait…
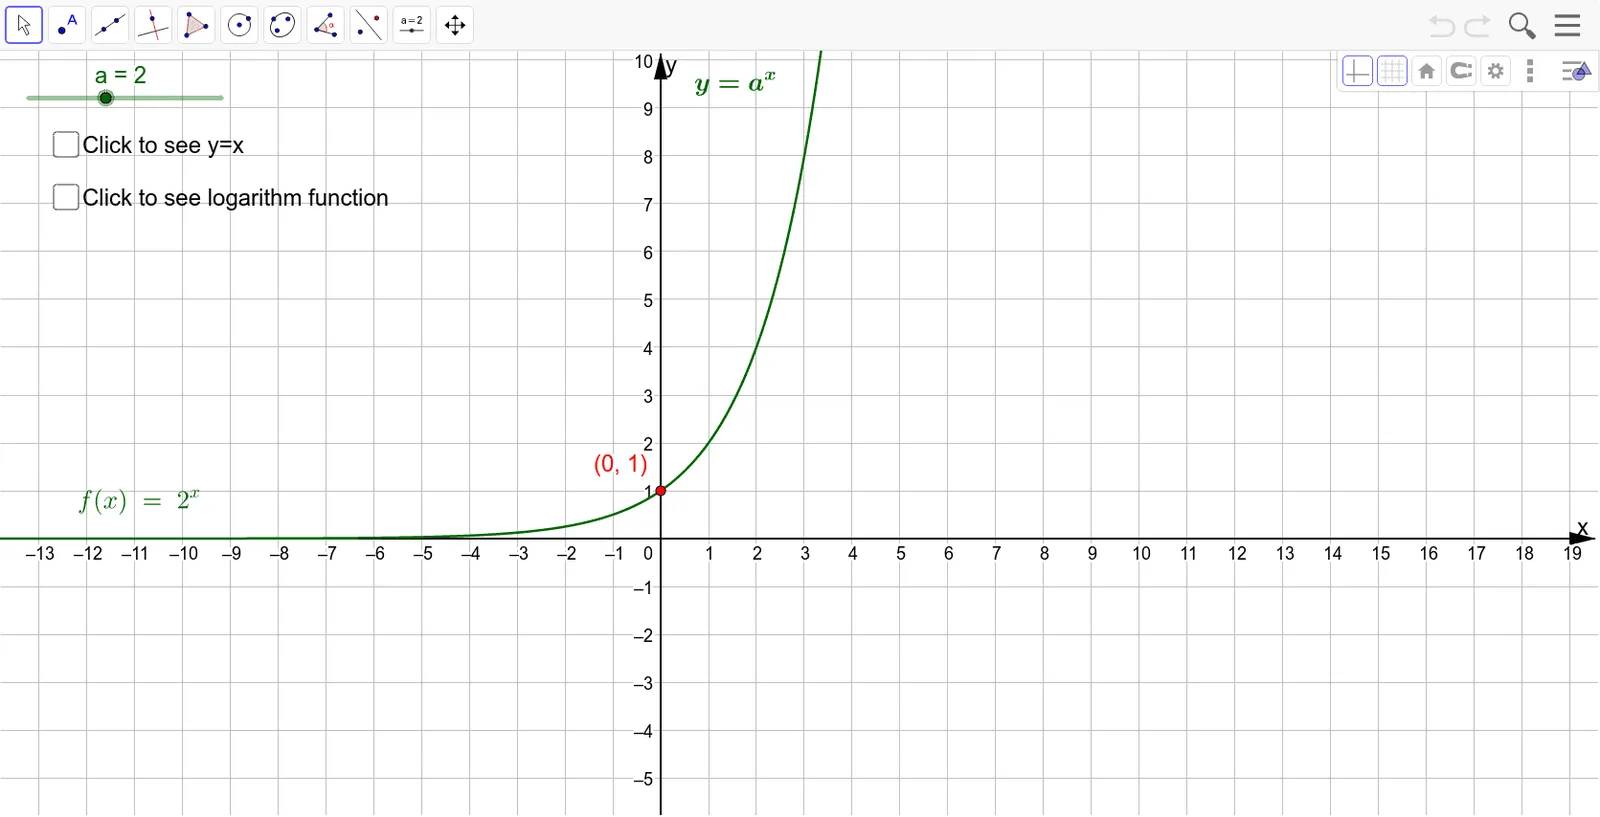
This example demonstrates the graphs of exponential and logarithmic functions, showcasing their shapes, asymptotes, and key properties. It involves core math concepts like exponential growth/decay, logarithmic scales, function plotting, derivatives, and limits. Constructed using GeoGebra objects such as sliders (a), functions (f, g), text annotations (text1, text2, text3), points (h, b, A, B), and calculations (c) to illustrate dynamic behavior. Ideal for high school and college students studying pre-calculus, calculus, and advanced function analysis.
GeoGebra Commands & Parameters
Numeric a(2)f(x) = a^(x)g(x) = log(a, x)y = xBoolean b(false)(0, 1)(1, 0)Boolean c(false)
AI Drawing Prompt Reference
Plot the graphs of exponential and logarithmic functions to display their shapes, asymptotes, and key properties. Use a slider to control the base, plotting the corresponding exponential and logarithmic functions, and include the line y=x as a reference. Mark two points near the origin and add text annotations to explain the properties of the functions and mathematical concepts like exponential growth/decay, logarithmic scales, and derivatives as needed.
The prompt above was compiled from the original drawing commands and is for reference only.