
Graphs of a Function and Its Derivative
Loading the math board and drawing, please wait…
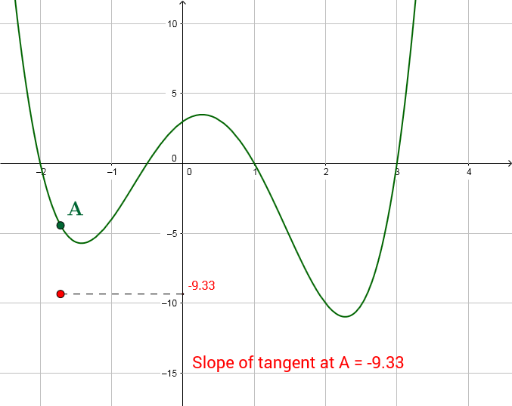
This example demonstrates the graphs of a function and its derivative. By observing the function graph, we can understand the function's increasing and decreasing intervals and extreme points. The derivative graph reveals the slope changes of the function at different points. The construction uses commands like Point and Segment, suitable for high school mathematics education and learning.
GeoGebra Commands & Parameters
Point(f) → ASegment((x(B), 0), B) → iSegment(B, (0, y(B))) → l