
Graphing to Solve Quadratic Equations I
Loading the math board and drawing, please wait…
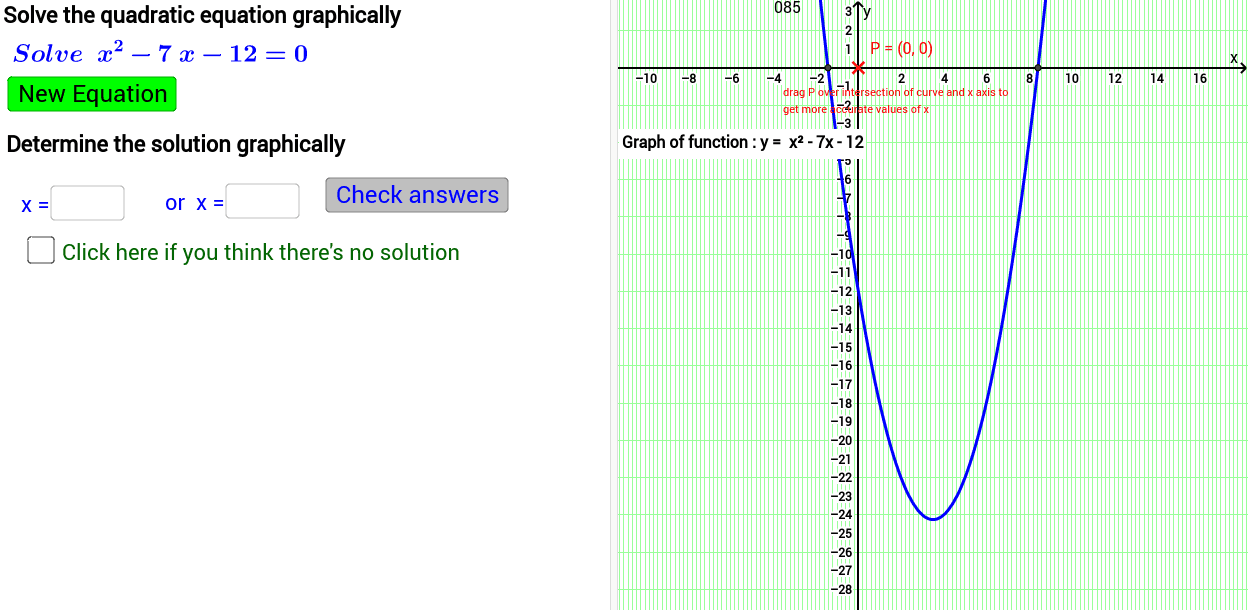
This example uses graphing to solve quadratic equations. It demonstrates the relationship between the graph of a quadratic function and its roots, involving key concepts such as roots and extrema. It utilizes commands like Sequence, Union, and RandomElement in GeoGebra, suitable for self-assessment and learning by middle school and above students.
GeoGebra Commands & Parameters
Sequence(i, i, 1, 20, 1) → list4Sequence(i, i, -20, -1, 1) → list1Union(list1, list4) → list5Sequence(i, i, -7, 9, 1) → list2RandomElement(list2) → bSequence(i, i, -13, 13, 1) → list3RandomElement(list3) → cSimplify((a * x^(2)) + (b * x) + c) → fRoot(f) → A, BTextfield(inputa) → InputBox1Textfield(inputb) → InputBox2Textfield(inputc) → InputBox3Textfield(inputx1) → InputBox4Textfield(inputx2) → InputBox5Roots(f, -30, 30) → C, D,Extremum(f, -30, 30) → EIf(discriminant < 0, x(E) - 5, If[discriminant ≟ 0, x(E) - 5, x(C) - abs(x(D) - x(C))]) → xMinView2If(y(E) < 0, y(E) + (0.2 * y(E)), (-abs((0.15 * y(E))))) → yMinView2If(y(E) > 0, y(E) + (0.2 * y(E)), abs((0.15 * y(E)))) → yMaxView2If(usera ≟ a, true, false) → correctaIf(userb ≟ b, true, false) → correctbIf(userc ≟ c, true, false) → correctcIf(abs(x(C) - Min[userx1, userx2]) < 0.055, true, false) → correctxminIf(abs(x(D) - Max[userx1, userx2]) < 0.055, true, false) → correctxmaxIf(b^(2) < (4 * ac), nosolncorrect, correctxmax ∧ correctxmin) → correctrootsPoint(xAxis) → PIf(If[discriminant < 0, x(E) + 5, If[discriminant ≟ 0, x(E) + 5, x(D) + abs(x(D) - x(C))]] < 0, 1, If[discriminant < 0, x(E) + 5, If[discriminant ≟ 0, x(E) + 5, x(D) + abs(x(D) - x(C))]]) → xMaxView2