
Graphing the Normal Curve with Mean and Standard Deviation
Loading the math board and drawing, please wait…
In collections
Continuous Random Variables
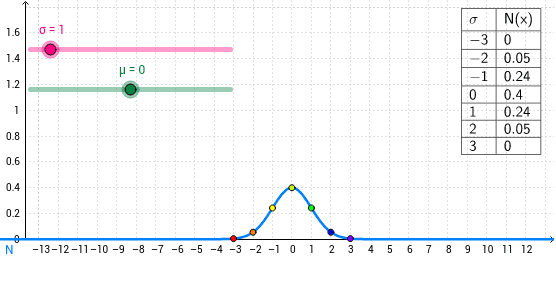
This GeoGebra example demonstrates how to graph a normal distribution curve based on a specified mean (μ) and standard deviation (σ), highlighting its symmetric bell-shaped form. The core mathematical concepts include the normal probability density function, how the mean shifts the curve horizontally, how the standard deviation affects its spread, and the relationship between variance and standard deviation. Construction details: the example uses Text and TableText commands to create dynamic labels and data tables, sliders or input fields to control μ and σ, and multiple point objects (such as A, B, C, etc.) along with a list (list1) to sample points on the curve, ultimately producing a smooth normal curve. This resource is suitable for high school and introductory college statistics courses, helping students visualize how changing parameters alters the distribution, and can also serve as a tool for teaching probability density functions.
GeoGebra Commands & Parameters
Text(x) → B1TableText({{C1, D1}, {C2, D2}, {C3, D3}, {C4, D4}, {C5, D5}, {C6, D6}, {C7, D7}, {C8, D8}}, "|_") → text1
AI Drawing Prompt Reference
Draw a symmetric bell-shaped normal distribution curve. The curve's horizontal position is set by the mean, and its spread is controlled by the standard deviation. Place a dynamic text label near the curve showing the current mean and standard deviation values. Below the graph, create a two-column data table listing several sample points with their x and y coordinates to help understand specific values on the curve. Use sliders or input fields to adjust the mean and standard deviation, so the curve updates in real time as parameters change.
The prompt above was compiled from the original drawing commands and is for reference only.