
Graphing the Derivative of a Function by Tim Brzezinski
Loading the math board and drawing, please wait…
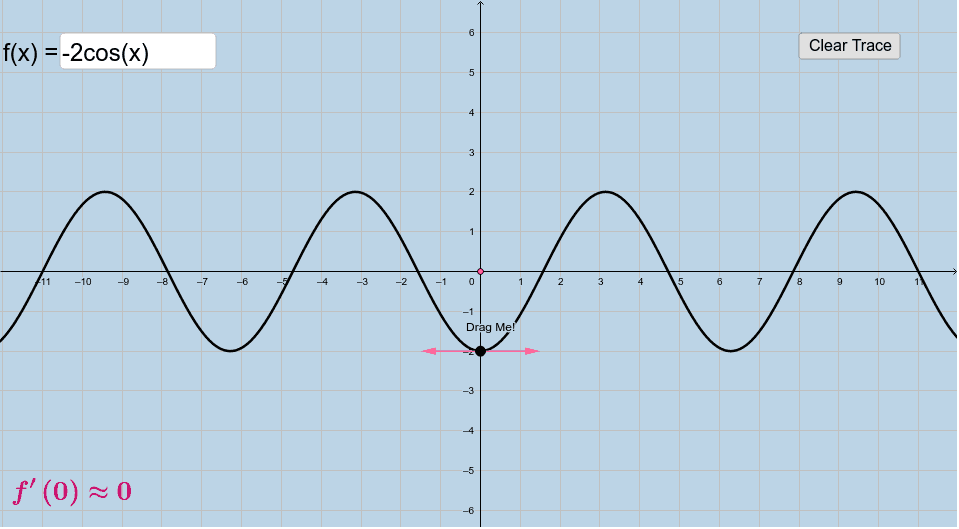
This example demonstrates how to dynamically trace and plot the graph of the derivative of any user-input function, visually revealing the geometric relationship between a function and its derivative. The core mathematical concepts include the geometric meaning of the derivative (slope of the tangent line), the rate of change of the function, and the derivative as a new function. Construction highlights: using GeoGebra commands such as Point, Tangent, Circle, Intersect, Segment, Vector, and Textfield, the example constructs a moving point A on the function f, its tangent line, and uses intersections and vectors to generate the derivative point g, with an input box and button for interactive function entry. Suitable for high school to college-level calculus instruction, this tool helps students grasp the derivative concept and can be used for classroom demonstrations or independent exploration.
GeoGebra Commands & Parameters
Point(f) → ATangent(A, f) → cCircle(A, 1.5) → dIntersect(d, c, 1) → CIntersect(d, c, 2) → DSegment(C, D) → eVector(A, D) → uVector(A, C) → vTextfield(f) → InputBox1