
Graphing Sine and Cosine Functions by M Braddock
Loading the math board and drawing, please wait…
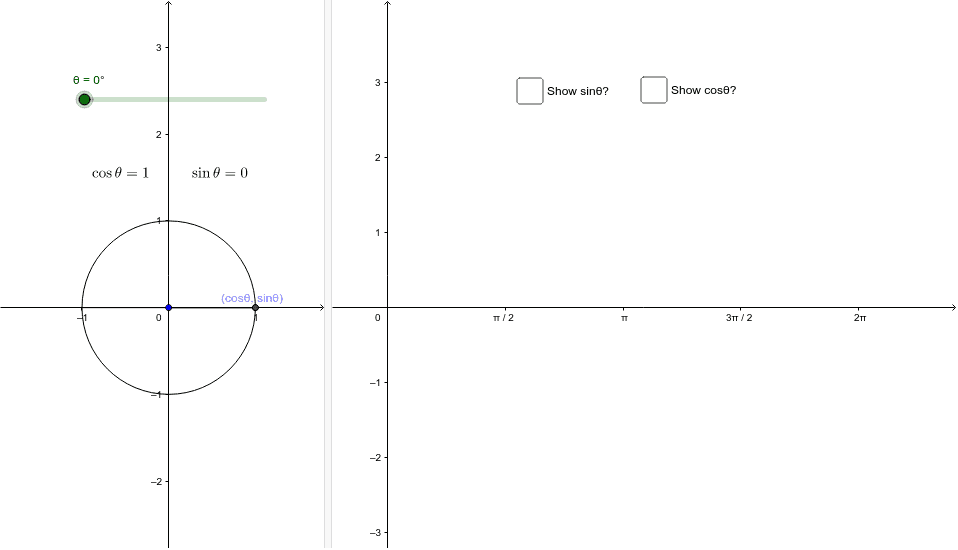
This example dynamically demonstrates the generation of sine and cosine function graphs by showing the unit circle and its traces. Key math concepts include trigonometric functions, unit circle, angles, and rotation. It uses GeoGebra commands like Circle, Point, Segment, Rotate, and Angle. Suitable for high school students learning trigonometry and analytical geometry to visually understand the relationship between function graphs and the unit circle.
GeoGebra Commands & Parameters
Circle(A, 1) → cPoint(c) → BSegment(A, B) → aPoint(c) → CSegment(A, C) → bRotate(B, θ, A) → B'Angle(B, A, B') → αSegment(A, B') → dSegment(B', D) → eSegment(A, D) → f
AI Drawing Prompt Reference
Draw a unit circle and mark a point on it. Connect the origin to this point to form a segment. From this point, rotate a certain distance based on angle θ to get a new point, and connect the origin to this new point. Then, draw a horizontal segment from the new point to the x-axis, and connect the origin to the intersection point on the x-axis. Finally, mark the sine and cosine values corresponding to angle θ on the unit circle, and show the relationship between these segments and points.
The prompt above was compiled from the original drawing commands and is for reference only.