
Graphing Sine and Cosine Functions by cemccourseware
Loading the math board and drawing, please wait…
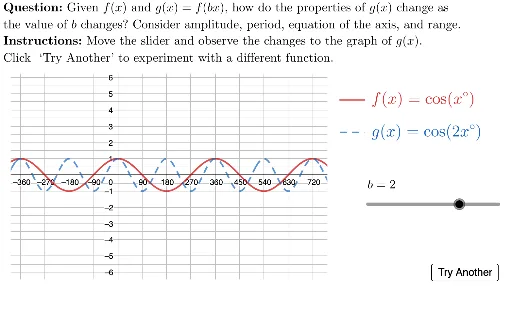
This example demonstrates how to graph sine and cosine functions using GeoGebra. The core math concepts involved include trigonometric functions, function graphs, symmetry, and transformations. Key GeoGebra commands and objects used are UnicodeToLetter, Polygon, LaTeX, Segment, Translate, HowDidIDo, TryAnother, xmark, cmark, incorrect, correct, isDone, bottomLeft, topRight, viewbox, showFeedback, b, f, isSinFunc, k, g, h, lblB, lblCos, lblCosBx, lblSin, lblSinBx, MainInstruc, SpecInstruc, legendAnchor1, legendSegment1, legendSegment2. Suitable for high school students learning about trigonometric functions and function graphs.
GeoGebra Commands & Parameters
UnicodeToLetter(10007) → xmarkUnicodeToLetter(10003) → cmarkPolygon({bottomLeft, (x(bottomLeft), y(topRight)), topRight, (x(topRight), y(bottomLeft))}) → viewboxLaTeX(("b=" * b)) → lblBLaTeX("f(x)=\cos(x°)") → lblCosLaTeX((("g(x)=\cos(" * b) * "x°)")) → lblCosBxLaTeX("f(x)=\sin(x°)") → lblSinLaTeX((("g(x)=\sin(" * b) * "x°)")) → lblSinBxLaTeX("\text{\textbf{Question: }Given \(f(x)\) and \(g(x)=f(bx)\), how do the properties of \(g(x)\) change as \\the value of \(b\) changes? Consider amplitude, period, equation of the axis, and range. }") → MainInstrucLaTeX("\text{\textbf{Instructions: }Move the slider and observe the changes to the graph of \(g(x)\).\\Click `Try Another' to experiment with a different function. ") → SpecInstrucSegment(legendAnchor1, legendAnchor1 + (90, 0)) → legendSegment1Translate(legendSegment1, (0, -2)) → legendSegment2