
Graphing Quadratic Functions by Marko Knežević
Loading the math board and drawing, please wait…
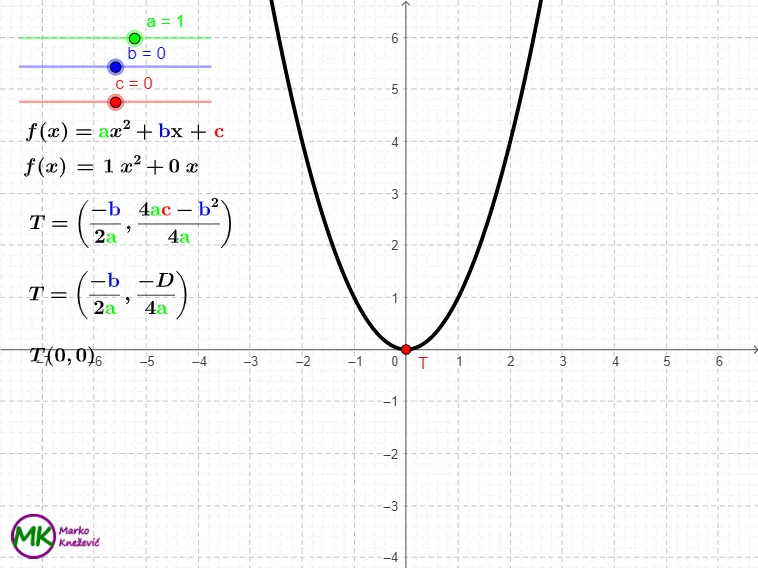
This example demonstrates the graphing of quadratic functions and their key features including extrema, intersections, and median values. It involves core math concepts like quadratic functions, derivatives, and optimization. Construction highlights include using GeoGebra commands such as Extremum for finding extrema, Intersect for intersection points, Vector for vectors, and LaTeX for displaying formulas. Objects like c, a, b, f, T, A, B, D, u, v, and text elements are utilized. Suitable for high school and above mathematics education for function analysis and property exploration.
GeoGebra Commands & Parameters
Extremum(f) → TIntersect(xAxis, yAxis) → AIntersect(xAxis, yAxis) → DVector(D, B) → uVector(B, T) → vLaTeX(f, true, true) → text1