
Functions' Monotonicity, Extreme Values, and Derivative
Loading the math board and drawing, please wait…
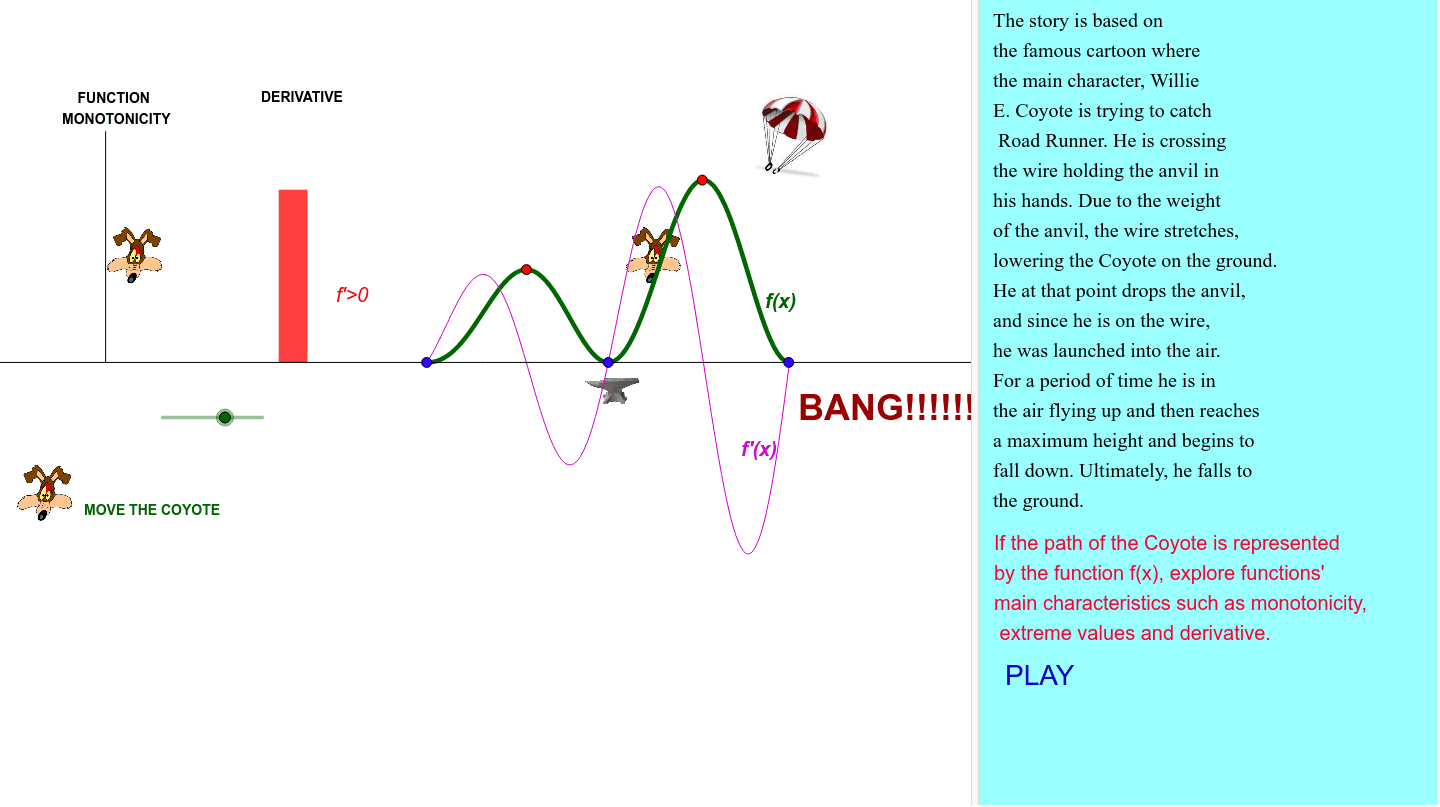
This example demonstrates the relationship between a function's monotonicity, extreme values, and its derivative. Key math concepts include function graphs, derivatives, intervals of increase/decrease, and extreme points. Construction involves commands like Segment, Derivative, Point, Polygon, Line, and Intersect in GeoGebra to plot the function, find its derivative, and highlight monotonic intervals and extrema. Suitable for high school mathematics education to understand the application of derivatives in function analysis.
GeoGebra Commands & Parameters
Segment(D, E) → bDerivative(f) → hPoint(xAxis) → GPolygon(I, J, K, L) → poly1, i, j, k, lPolygon(I, L, M, N) → poly2, i_1, l_1, m, nPolygon(O, P, Q, R) → poly3, o, p, q, rPoint(xAxis) → BPoint(xAxis) → CLine(C, B) → cPoint(f) → SIntersect(f, h, (4.712388980382138, 0)) → TPoint(f) → UPoint(c) → VPoint(c) → WIntersect(c, b) → ZPoint(b) → A_1Point(b) → B_1
AI Drawing Prompt Reference
Draw a function and its derivative, highlighting the intervals of increase/decrease and extreme values. Plot the function curve and its derivative curve with distinct colors or line styles. Mark the extreme points on the function curve and connect them to the x-axis with line segments to form shaded regions indicating monotonic intervals. Finally, draw two points on the x-axis and connect them to form a horizontal line, identifying specific intersection points with the derivative curve and the function curve.
The prompt above was compiled from the original drawing commands and is for reference only.