
Graphing Parabolas: Hand-Drawn Practice and Parameter Adjustment
Loading the math board and drawing, please wait…
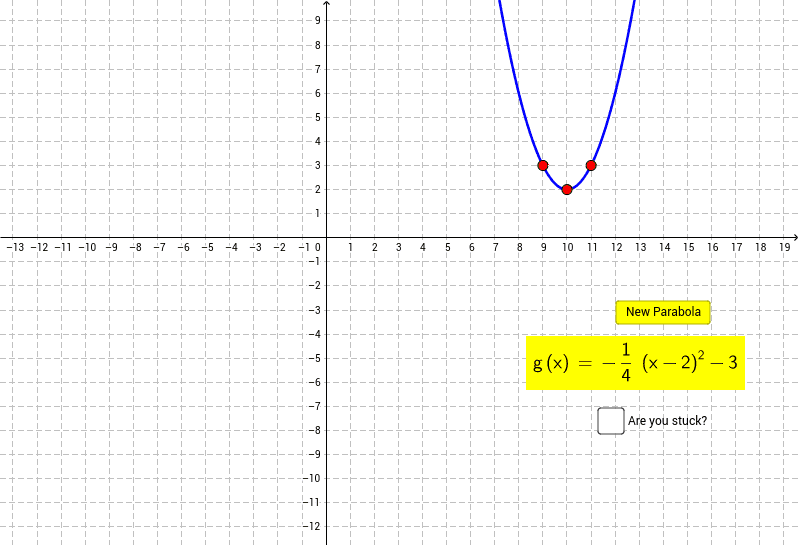
This example demonstrates how to adjust a blue parabola by dragging red points to match a given figure. Key mathematical concepts include quadratic functions, parabola properties, and parameter changes. Construction involves GeoGebra commands like Random, FitPoly, and LaTeX, along with objects such as risechoice, yvertex, xvertex, etc. Suitable for middle or high school students to practice hand-drawn function graphs and understand parabola parameter relationships.
GeoGebra Commands & Parameters
Random(-4, 4) → yvertexRandom(-4, 4) → xvertexRandomElement(risechoice) → riseRandomElement(runchoice) → runFitPoly({A, B, C}, 2) → fLaTeX(g, true, true) → text2
AI Drawing Prompt Reference
Draw a parabola with a vertex at a randomly generated coordinate. Adjust the parabola's direction and position by dragging two red points to match a given figure. The vertex coordinates are determined by two random numbers, and the direction is set by another random number. Use a quadratic polynomial to fit three points and draw the parabola.
The prompt above was compiled from the original drawing commands and is for reference only.