
Graphing Linear Systems Quiz
Loading the math board and drawing, please wait…
In collections
A1.ACE.1 - Create and solve equations and inequalities
Systems of Linear Equations
Test 3 Review Activities
System of Equations
This example demonstrates solving systems of linear equations by graphing, involving core math concepts like linear equations, linear functions, and coordinate geometry. It utilizes GeoGebra commands and objects such as Random, Line, Sequence, Union, RandomElement, Slope, FractionText, and Textfield. Suitable for high school students to learn the solution methods of linear systems, ideal for classroom demonstrations and interactive practice.
GeoGebra Commands & Parameters
Random(-10, 10) → aRandom(-10, 10) → bRandom(-10, 10) → cLine(A, B) → fSequence(i, i, -10, y(B) - 1, 1) → dlowerSequence(i, i, y(B) + 1, 10, 1) → dupperUnion(dlower, dupper) → dlistRandomElement(dlist) → dLine(A, C) → gSlope(f) → eSlope(g) → hFractionText(e) → text1FractionText(h) → text2Line(D, E) → iLine(G, F) → jTextfield(k) → InputBox1Textfield(l) → InputBox2
AI Drawing Prompt Reference
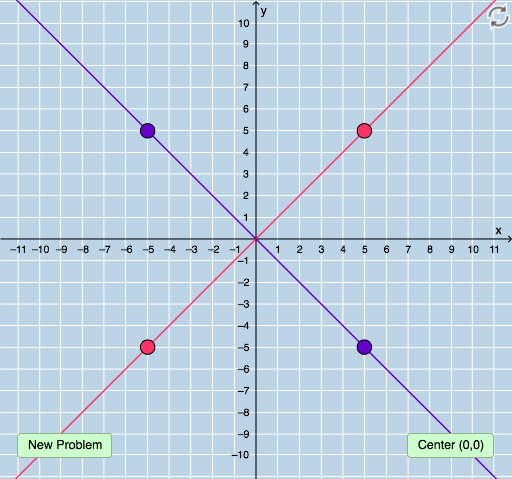
Draw two lines with slopes as random integers a/b and c/d respectively. Set the intersection point of these two lines and display them on the coordinate system. Users need to input the coordinates of the intersection point to check their answers.
The prompt above was compiled from the original drawing commands and is for reference only.