
Graphing Linear Relations from Slope and Y-Intercept
Loading the math board and drawing, please wait…
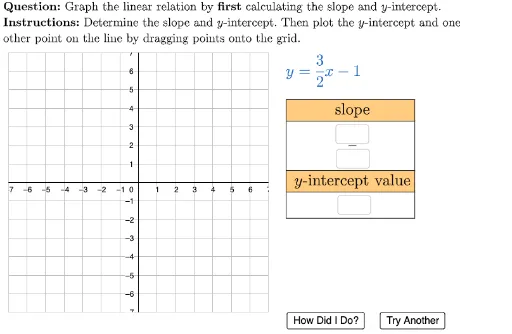
This example demonstrates how to graph a line using the slope and y-intercept. Key math concepts include linear equations. The construction summary mentions the use of GeoGebra commands such as Sequence, Polygon, Element, Zip, etc. Suitable for middle school and above students to learn how to graph linear equations.
GeoGebra Commands & Parameters
Sequence((i, -3.65), i, 11.5, 12.5, 1) → homeBasePointsPolygon((-7, -7), (-7, 7), (7, 7), (7, -7)) → viewBox, f, g, h, iElement(questionList, questionListIndex) → questionNumElement(C2:C5, questionNum) → currentSlopeElement(D2:D5, questionNum) → currentYInterceptElement(B2:B5, questionNum) → currentRunElement(A2:A5, questionNum) → currentRiseZip(A ≟ B, A, usersPreTaskValues, B, {currentSlope, currentYIntercept}) → arePreTasksCorrectDynamicCoordinates(freeA, If[IsInRegion[freeA, viewBox], x(freeA), x(Element[homeBasePoints, 1])], If[IsInRegion[freeA, viewBox], y(freeA), y(Element[homeBasePoints, 1])]) → ADynamicCoordinates(freeB, If[IsInRegion[freeB, viewBox], x(freeB), x(Element[homeBasePoints, 2])], If[IsInRegion[freeB, viewBox], y(freeB), y(Element[homeBasePoints, 2])]) → BFitPoly(usersPoints, 1) → usersLineElement(H2:H5, questionNum) → dottedCorrectLineUnicodeToLetter(10007) → xmarkUnicodeToLetter(10003) → cmarkLaTeX("\text{Points:}") → pointsLabelLaTeX("\text{Please plot all points.}") → feedbackPlotAllPointsElement(J2:J5, questionNum) → displayEquationTextfield(textPreTask1) → ansBoxPreTask1Textfield(textPreTask2) → ansBoxPreTask2Zip("\vphantom{\dfrac{\dfrac{1}{2}}{\dfrac{3}{4}}}" + (If[¬A, B, ""]), A, arePreTasksCorrect, B, {(((("\text{slope}=\dfrac{" * currentRise) * "}{") * currentRun) * "}"), ("y\text{-intercept}=" * currentYIntercept)}) → hintsTableText({hints}, "v") → preTaskLabelHintPoint({0, D2}) → E2Point({0, D3}) → E3Point({0, D4}) → E4Point({0, D5}) → E5Line(E2, F2) → H2Line(E3, F3) → H3Line(E4, F4) → H4Line(E5, F5) → H5Polygon(E2, F2, G2) → I2, g2, K2, L2Polygon(E3, F3, G3) → I3, J3_1, K3, L3Polygon(E4, F4, G4) → I4, J4_1, K4, L4Polygon(E5, F5, G5) → I5, J5_1, K5, L5Textfield(textPreTask3) → ansBoxPreTask3Element(I2:I5, questionNum) → slopeTriangleLaTeX("\text{A linear relation of the form\\\(y=mx+b\) has a slope of \(m\)\\and a \(y\)-intercept of \(b\).}") → feedbackPreTaskALaTeX("\text{First rearrange the equation into\\the form \(y=mx+b\). Then, the\\linear relation will have a slope of\\\(m\) and a \(y\)-intercept of \(b\).}") → feedbackPreTaskBIf(questionNum ≟ 1 ∨ questionNum ≟ 3, feedbackPreTaskA, feedbackPreTaskB) → feedbackPreTaskLaTeX("\text{\textbf{Question: }Graph the linear relation by \textbf{first} calculating the slope and \(y\)-intercept.\\\textbf{Instructions: }Determine the slope and \(y\)-intercept. Then plot the \(y\)-intercept and one\\other point on the line by dragging points onto the grid.}") → TEXTTableText({{"\cellcolor{#ffcc80}{\text{slope}}"}, {(((("\dfrac{\vphantom{\frac{1}{2}}" * currentRise) * "}{\vphantom{\frac{1}{2}}") * currentRun) * "}")}, {"\cellcolor{#ffcc80}{y\text{-intercept value}}"}, {"\vphantom{\tfrac{1}{2}}" + currentYIntercept}}, "|_c") → preTaskLabel