
Graphing Linear Inequalities in Two Variables by Tom Owsiak
Loading the math board and drawing, please wait…
In collections
Linear Inequalities in 2 Variables
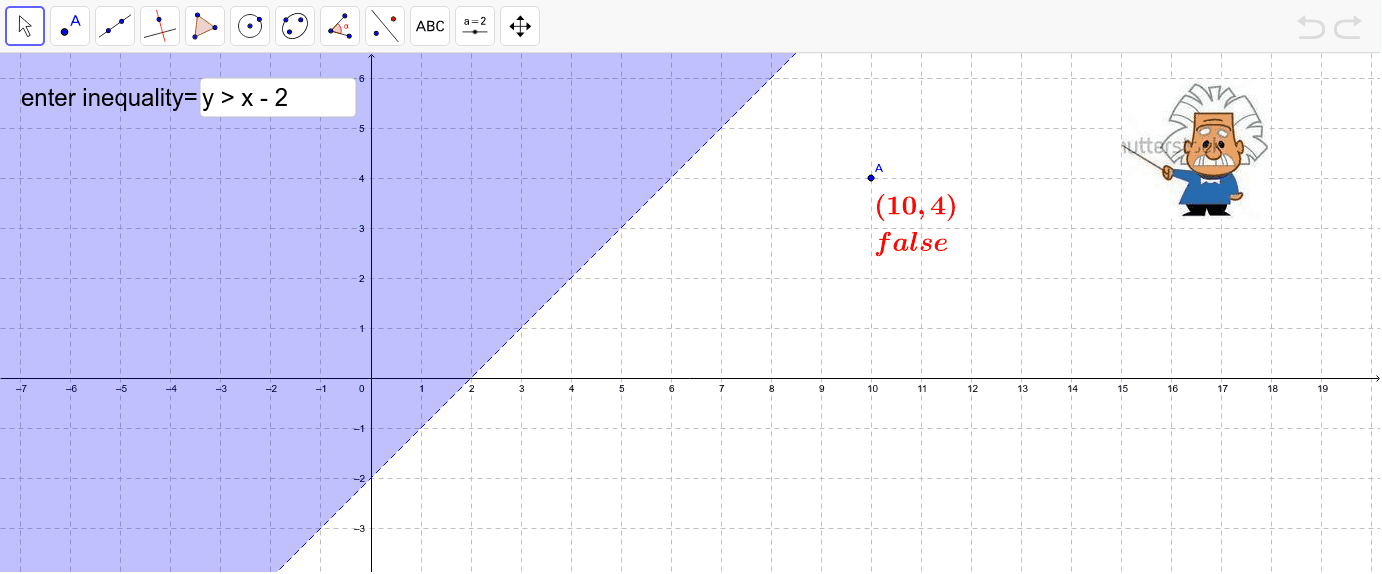
This example demonstrates how to graph linear inequalities in a two-dimensional coordinate system. The core math concepts involved include inequalities, linear equations, and region representation. Construction highlights: Utilize the Textfield command to create a text input box; employ the inputBox1 object to acquire user-input coefficients; define line parameters via objects A and b; display the inequality expression using text1; and draw the graph using the pic1 object. Suitable for high school mathematics education, helping students understand the geometric meaning of inequality solution sets and graphing techniques.
GeoGebra Commands & Parameters
Textfield(a) → inputBox1
AI Drawing Prompt Reference
Draw a graph of a linear inequality in a two-dimensional coordinate system. First, create a text input box for users to enter the coefficients of the linear inequality. Then, define the parameters of the line based on the input coefficients and display the inequality expression. Finally, use the drawing area to plot the graph of the inequality, helping to understand the geometric meaning of the solution set.
The prompt above was compiled from the original drawing commands and is for reference only.