
Graphing Linear Equations in Slope-Intercept/Standard Form
Loading the math board and drawing, please wait…
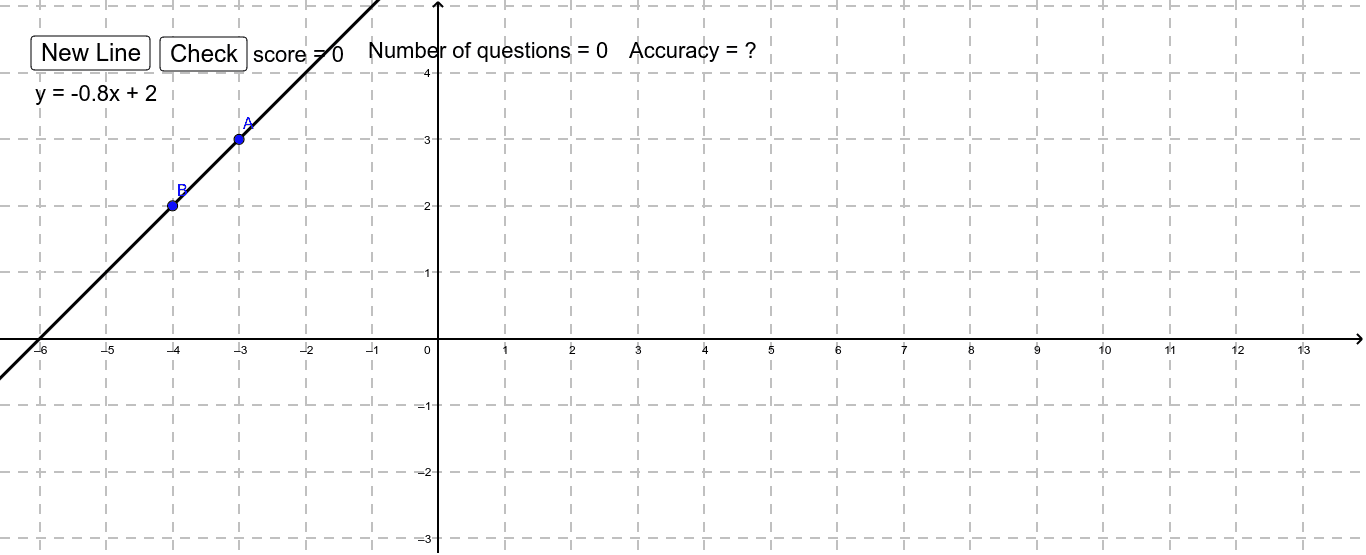
This example demonstrates how to plot linear equations in slope-intercept and standard forms using GeoGebra. Key mathematical concepts include the representation of linear equations, the relationship between slope and intercept, and graphical representation in coordinate systems. Construction involves using commands like Line, RandomElement, and Random to generate line objects, along with Text for labeling parameters. Suitable for middle school students learning linear equation graphing or for educational tools.
GeoGebra Commands & Parameters
Line(A, B) → aRandomElement({-4, -3, -2.5, -2, -1.5, -1, -0.8, -0.75, -0.6, -0.5, -0.4, -0.25, -0.2, 0.2, 0.25, 0.4, 0.5, 0.6, 0.75, 0.8, 1, 1.5, 2, 2.5, 3, 4}) → mRandom(-5, 5) → bRandomElement({1, 2}) → rText(("score = " * score)) → text1Text(l1) → text2Text(l2) → text3Text(("Number of questions = " * problems)) → questionsText(("Accuracy = " * accu)) → accur
AI Drawing Prompt Reference
Draw a straight line to show the relationship between slope and intercept. The line is determined by two points, with slope being positive or negative and intercept on the axes. Draw the line in a coordinate system and label the slope and intercept values to help understand the graphical representation of linear equations.
The prompt above was compiled from the original drawing commands and is for reference only.