
Graphing Exponential Functions by raystuckey1
Loading the math board and drawing, please wait…
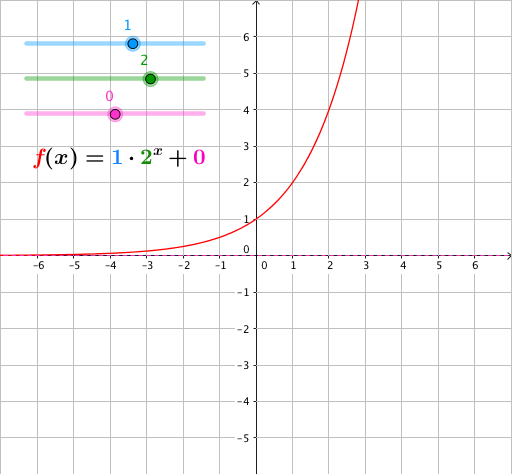
This example demonstrates how to graph exponential functions and illustrates the transformation rules of their graphs. Key math concepts include the properties of exponential functions, similarity transformations of function graphs, and the impact of parameters on function images. GeoGebra commands/objects used in construction include a (constant), r (base), h (horizontal shift), f (function), g (graph), and text1 (text label). Suitable for high school students learning about exponential functions and their graph transformations, helping to understand the dynamic changes in function graphs.
GeoGebra Commands & Parameters
Numeric a(1.0)Numeric r(2.0)Numeric h(0.0)f(x) = (a * r^(x)) + hy = h