
Graphing Cosine from the Unit Circle
Loading the math board and drawing, please wait…
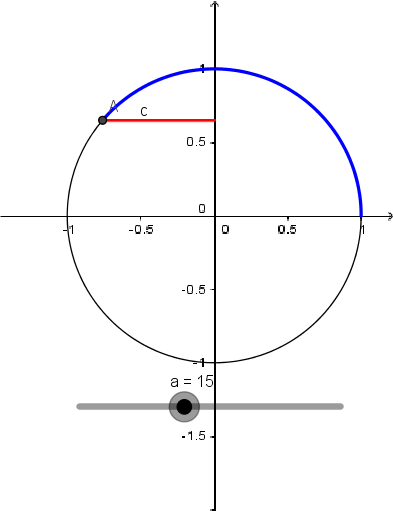
This GeoGebra example demonstrates how the cosine function graph is generated from the unit circle. It visualizes the fundamental trigonometric concept that the x-coordinate of a point on the unit circle equals the cosine of the corresponding angle. The construction uses the Arc command to draw arcs on the circle)Skip, and Segment command to create connecting segments, with objects such as circle c, angle a, point A, and auxiliary elements d, i, g, f, h to dynamically link the angle to the plotted cosine curve. As the angle changes, the trace of the cosine value forms the familiar wave. This is ideal for high school trigonometry or introductory calculus, helping students bridge geometric definitions and function graphs.
GeoGebra Commands & Parameters
Arc(c, (1, 0), (cos(a), sin(a))) → dSegment((0, 0), (a, 0)) → iSegment((0, sin(a)), (cos(a), sin(a))) → gSegment((a, 0), (a, cos(a))) → h
AI Drawing Prompt Reference
Draw a unit circle centered at the origin with radius 1. Place a moving point on the circle, whose position is determined by an angle parameter measured counterclockwise from the positive x-axis. Draw a radius from the origin to this point, and a vertical segment from the point down to the x-axis, representing its x-coordinate. Below the x-axis, draw a horizontal segment from the origin along the x-axis with length equal to the angle value. From the end of this horizontal segment, draw a vertical segment upward with length equal to the x-coordinate of the moving point. As the angle changes, the endpoints of these vertical segments trace out the cosine wave. Also, draw an arc on the circle from the positive x-axis intersection to the moving point to indicate the angle. This construction shows the correspondence between the x-coordinate on the unit circle and the cosine function graph.
The prompt above was compiled from the original drawing commands and is for reference only.