
Graphing Compound Inequalities by Κασκαντάμης Μιχάλης
Loading the math board and drawing, please wait…
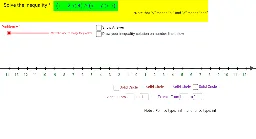
This GeoGebra example demonstrates how to graph compound inequalities on a coordinate plane, allowing users to input inequalities via text fields and see the solution region update dynamically. It covers core concepts such as inequality notation, interval representation, and the logical AND/OR operations that define compound solution sets. The construction uses Textfield and Sequence commands, along with multiple input boxes (inputBox1, inputBox2, inputBox5, inputBox6), text objects (text1, text2, text12, text13), points (A, B, C, D), and auxiliary elements like line g, to create an interactive learning tool. It is ideal for middle and high school mathematics classes focusing on inequalities, and for teachers who want to visually demonstrate how changing inequality parameters affects the solution region.