
Solving Linear Systems by Graphing: Quiz
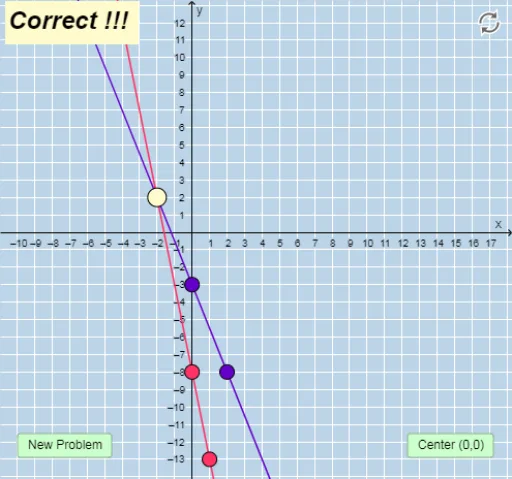
Loading the math board and drawing, please wait…
This example demonstrates solving systems of linear equations by graphing. Key math concepts include linear equations and functions. Users practice graphing randomly generated linear equations to find the intersection points. GeoGebra commands used include Random, Line, Sequence, Union, RandomElement, etc. Suitable for middle school and above students for learning and practice.
GeoGebra Commands & Parameters
Random(-10, 10) → aRandom(-10, 10) → bRandom(-10, 10) → cLine(A, B) → fSequence(i, i, -10, y(B) - 1, 1) → dlowerSequence(i, i, y(B) + 1, 10, 1) → dupperUnion(dlower, dupper) → dlistRandomElement(dlist) → dLine(A, C) → gSlope(f) → eSlope(g) → hFractionText(e) → text1FractionText(h) → text2Line(D, E) → iLine(G, F) → jTextfield(k) → InputBox1Textfield(l) → InputBox2
AI Drawing Prompt Reference
Create a coordinate plane for practicing solving linear systems by graphing. Draw two random straight lines that intersect at a single point, representing the solution. Near the intersection, indicate the slopes of both lines using dashed or colored segments, and display each slope as a fraction. Place two input boxes below or beside the graph for entering the coordinates of the intersection point. Additionally, generate a series of evenly spaced horizontal reference points above and below the intersection to help locate it visually. The layout should be clean and educational, emphasizing the relationship between the lines' crossing and the system's solution.
The prompt above was compiled from the original drawing commands and is for reference only.