
Graphing an Antiderivative Function
Loading the math board and drawing, please wait…
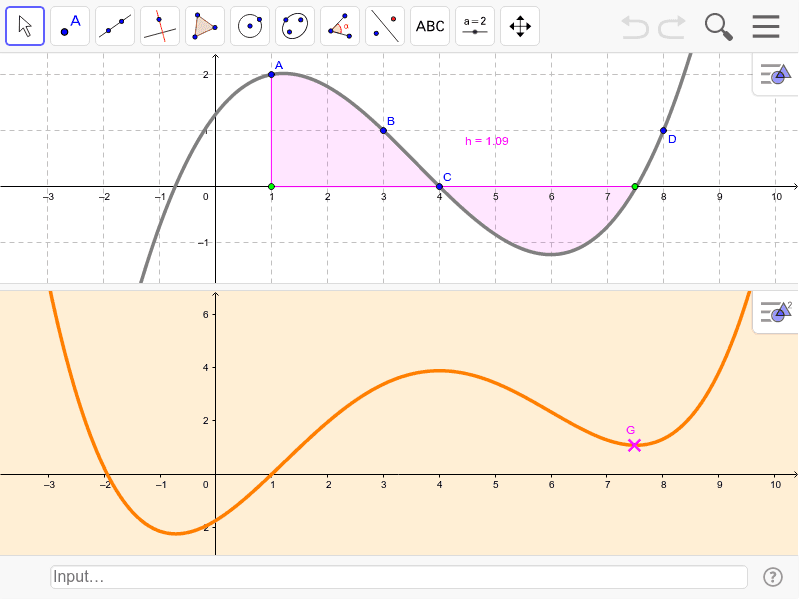
This example demonstrates how to graph an antiderivative function. Key mathematical concepts include integration. Construction highlights the use of FitPoly, Integral, and Locus commands in GeoGebra. Suitable for calculus courses.
GeoGebra Commands & Parameters
FitPoly({A, B, C, D}, 5) → fFitPoly({A, B, C, D}, 3) → gPoint(xAxis) → EPoint(xAxis) → FIntegral(g, x(E), x(F)) → hLocus(G, F) → loc1Corner(1, 1) → PCorner(1, 2) → Q
AI Drawing Prompt Reference
Graph the antiderivative of a function. First, fit a 5th-degree polynomial through points A, B, C, and D to get function f. Then, fit a 3rd-degree polynomial through these points to get function g. Select two points E and F on the x-axis, and calculate the integral of g from E to F to get function h. Next, trace g with F as the parameter to get the locus loc1. Finally, determine two corner points P and Q.
The prompt above was compiled from the original drawing commands and is for reference only.