
Graphing Absolute Value Functions by Pascal Guilloux
Loading the math board and drawing, please wait…
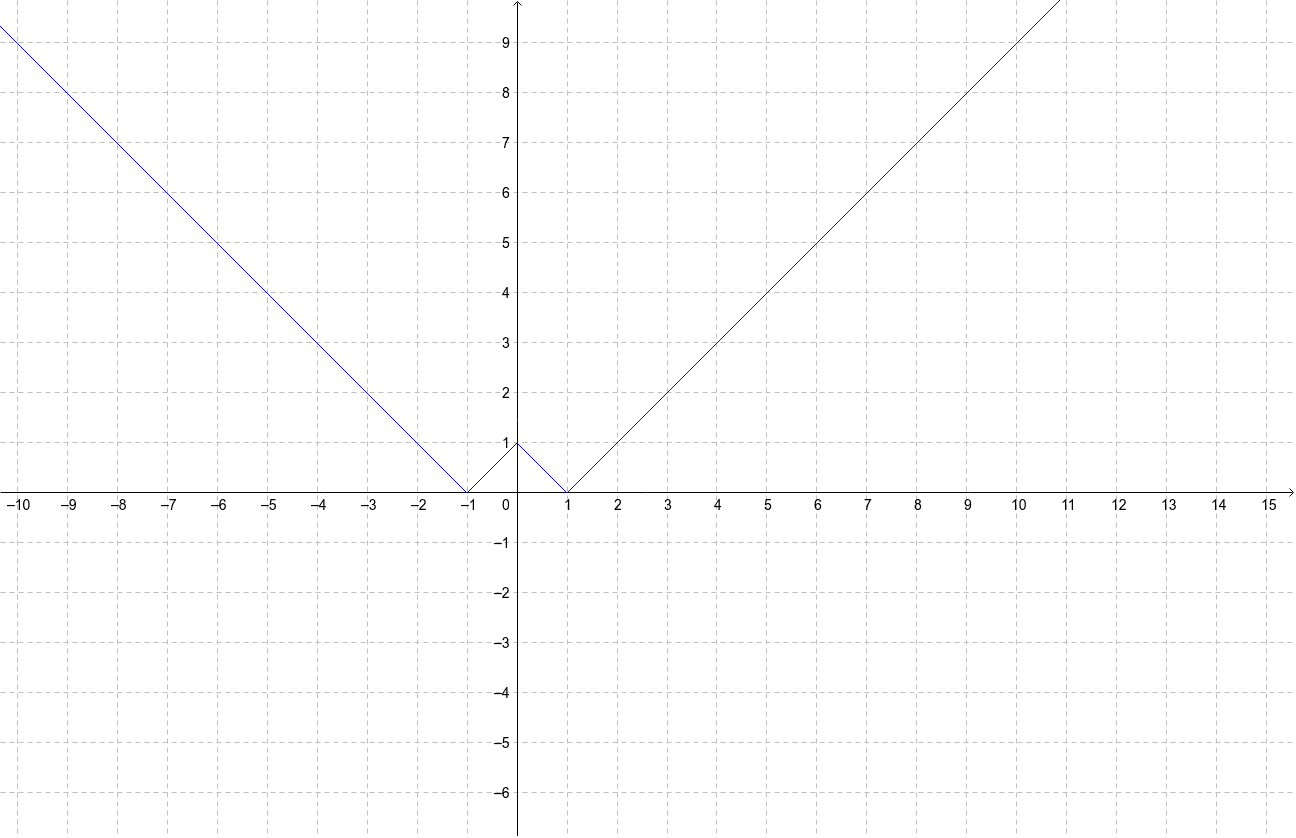
This example demonstrates the graph of the function y=| |x|-1|, highlighting key concepts like absolute value functions, piecewise definitions, and symmetry. It uses the GeoGebra command 'f' for function plotting, making it suitable for high school mathematics education to explore transformations and properties of absolute value functions.
GeoGebra Commands & Parameters
f(x) = abs(abs(x) - 1)
AI Drawing Prompt Reference
Graph the function y=| |x|-1| to demonstrate the properties of absolute value functions, including piecewise definitions and symmetry, suitable for high school mathematics education to explore transformations and the characteristics of absolute value functions.
The prompt above was compiled from the original drawing commands and is for reference only.