
Graphing a System of Inequalities Using Two Points per Line
Loading the math board and drawing, please wait…
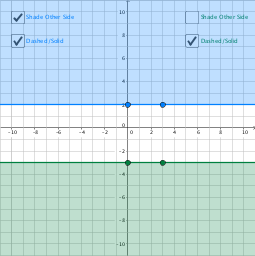
This example demonstrates how to graph a system of linear inequalities by selecting two points for each boundary line. The core mathematical concepts include systems of inequalities, linear equations, half-planes, and the feasible region (intersection of shaded areas). Construction highlights: using GeoGebra's Line command with points P1, P2 to define boundary lines l1, and employing a button (button1) to toggle visibility, while parameters a, b, c adjust inequality directions, ultimately producing regions f and g. Suitable for middle-to-high school students learning introductory linear programming, or for teachers illustrating the geometric meaning of solution sets for inequality systems.
GeoGebra Commands & Parameters
Line(P1, P2) → aLine(P1_1, P2_1) → a_1