
Graphing a Polynomial Function and Analyzing Zeros and Extrema
Loading the math board and drawing, please wait…
In collections
CCGPS AA Unit 6 Lesson 1
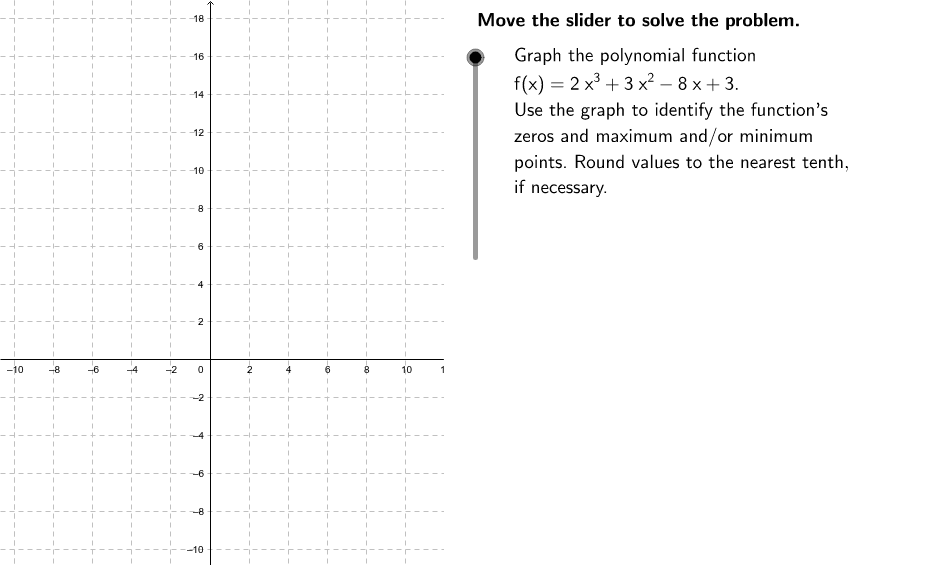
This example demonstrates how to graph the polynomial function f(x) = 2x³ + 3x² – 8x + 3 and use the graph to identify its zeros, maximum, and minimum points. Key math concepts include polynomial functions, function graphs, zeros, extrema, and applications of derivatives. The construction involves GeoGebra commands/objects like Simplify, Corner, Polygon, Max, and Min. Suitable for high school students learning function analysis, extrema determination, and GeoGebra plotting techniques, ideal for classroom instruction or homework assistance.
GeoGebra Commands & Parameters
Simplify(ffact) → fCorner(3) → C3Corner(1) → C1Corner(4) → C4Corner(2) → C2Polygon(C2, C3, (Edge, y(C3)), (Edge, y(C2))) → Mask, c2, c3, d, eMax(f, (-w), 0) → MaxPMin(f, 0, v) → MinP