
Graphing a Hyperbola and Ellipse
Loading the math board and drawing, please wait…
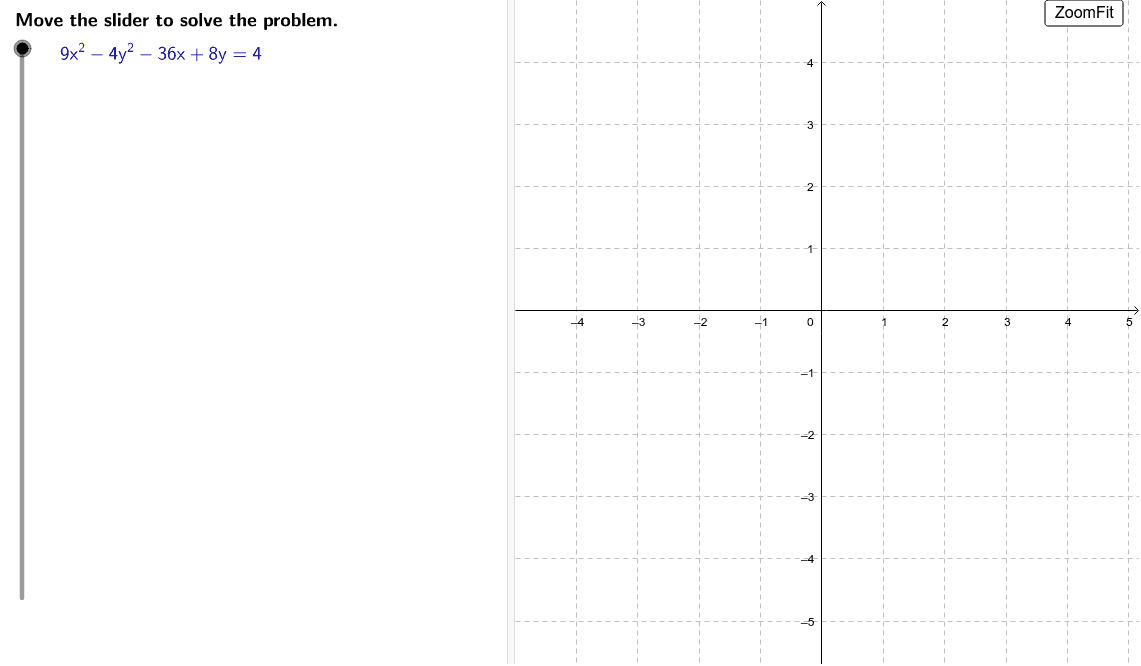
This example demonstrates how to graph the equation 9x^2 – 36x – 4y^2 + 8y = 4. Key mathematical concepts include the properties of conic sections and the graphical representation of equations. Using GeoGebra commands such as LaTeX and Polynomial, the graph of the equation can be constructed. Suitable for high school mathematics courses focusing on coordinate geometry.
GeoGebra Commands & Parameters
LaTeX(steps) → counterLaTeX("\text{Move the slider to solve the problem.}") → text0LaTeX("\text{Use the buttons below to return to the original}\cr\text{problem or randomly generate a similar practice}\cr\text{problem.}") → RandomizationTextCorner(1) → ACorner(3) → BLaTeX((("\textcolor{#000099}{" * c) * "}")) → ProblemPolynomial((yden / xden * (x - h)) + k) → fLaTeX((("\textcolor{#000099}{y=" * f) * "}")) → text40Polynomial((((-yden)) / xden * (x - h)) + k) → gLaTeX((("\textcolor{#000099}{y=" * g) * "}")) → text40bSegment(D, E) → dSegment(F, G) → ePolygon(C1, C2, C3, C4) → poly1, c1, c2, c3, c4LaTeX((((((((("\textcolor{#000099}{y-(" * y(C)) * ")=\pm\frac{") * yden) * "}{") * xden) * "}(x-(") * x(C)) * "))}")) → text38LaTeX((((((((((((((((((((((((("\textcolor{#000099}{" * xfact) * "[x^2-(") * midx) * ")x+") * hsq) * "]") * ypolysign) * "") * yfact) * "[y^2-(") * midy) * ")y+") * ksq) * "]}\cr\text{ }\textcolor{#000099}{ =") * oconst) * "+(") * xfact) * ")(") * hsq) * ")+(") * yfact) * ")(") * ksq) * ")}")) → text12LaTeX((((((((((((("\textcolor{#000099}{" * xfact) * "[x^2-(") * midx) * ")x+\ldots]") * ypolysign) * "") * yfact) * "[y^2-(") * midy) * ")y+\ldots]=") * oconst) * "}")) → text10LaTeX((((((((((((("\textcolor{#000099}{" * xfact) * "[x-(") * h) * ")]^2") * ypolysign) * "") * yfact) * "[y-(") * k) * ")]^2 =") * coeffprod) * "}")) → text14LaTeX((((((((((((((((("\textcolor{#000099}{\frac{" * xfact) * "[x-(") * h) * ")]^2}{") * coeffprod) * "}+\frac{(") * yfact) * ")[y-(") * k) * ")]^2}{") * coeffprod) * "}=\frac{") * coeffprod) * "}{") * coeffprod) * "}}")) → text16LaTeX((((((((((((("\textcolor{#000099}{" * xsign) * "\frac{[x-(") * h) * ")]^2}{") * xden) * "^2}") * ysign) * "\frac{[y-(") * k) * ")]^2}{") * yden) * "^2}=1}")) → text18LaTeX((((((((((((("\text{The equation in standard form is }\cr\textcolor{#000099}{" * xsign) * "\frac{[x-(") * h) * ")]^2}{") * xden) * "^2}") * ysign) * "\frac{[y-(") * k) * ")]^2}{") * yden) * "^2}=1}\text{.}")) → text19