
Graphical Visualization of the Inverse Sine of y (arcsin)
Loading the math board and drawing, please wait…
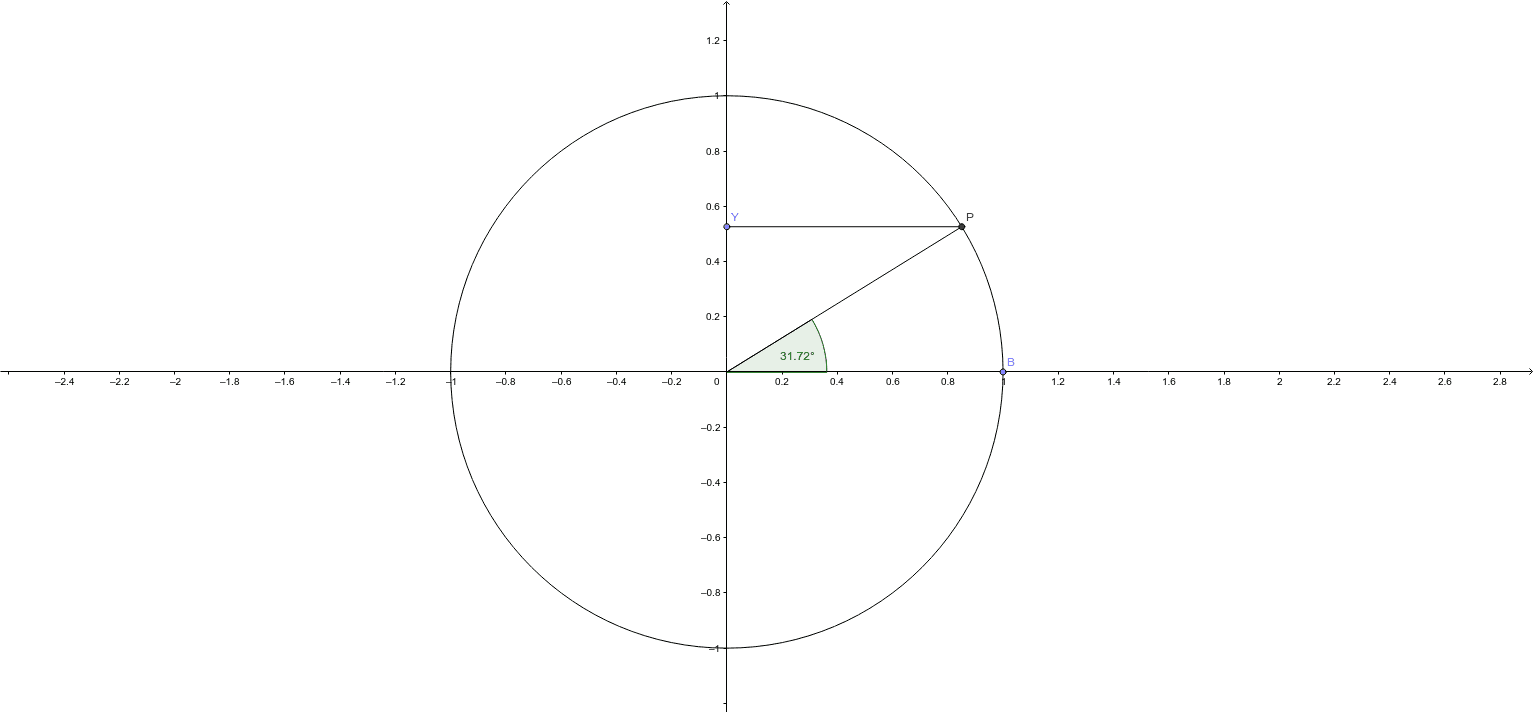
① This example provides an interactive graphical view of the meaning of arcsin(y), showing how a given y-value corresponds to an angle α on the unit circle. ② The core mathematical concept is the inverse trigonometric function, specifically the arcsine, including its domain, range, and relationship to the sine function, along with angle measurement and right-triangle side ratios. ③ Construction details: Using GeoGebra commands such as Intersect, Point, Circle, OrthogonalLine, Segment, and Angle, the objects A, B, c, Y, a, P, E, b, α, and d are created. By dragging point Y or a slider, the y-value changes dynamically, and the resulting angle α is updated in real time. ④ This resource is suitable for high school or early college students learning inverse trigonometric functions, and serves as an effective teaching aid for instructors or a self-exploration tool for learners to grasp the definition and graph of arcsin.
GeoGebra Commands & Parameters
Intersect(xAxis, yAxis) → APoint(xAxis) → BCircle(A, B) → cPoint(yAxis) → YOrthogonalLine(Y, yAxis) → aIntersect(c, a) → P, ESegment(Y, P) → bAngle(B, A, P) → αSegment(A, P) → d
AI Drawing Prompt Reference
Draw a unit circle and let point Y move along the y-axis. Draw a perpendicular line from Y to the y-axis, which intersects the circle at point P. Connect YP and AP. The length of YP represents the given y value, and ∠BAP is the value of arcsin(y). As Y moves, ∠BAP updates in real time.
The prompt above was compiled from the original drawing commands and is for reference only.